Figures & data
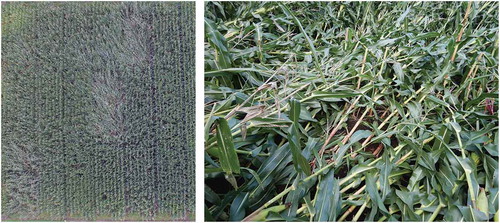
Table 1. Meteorological data for 2016 and 2017 during experiments.
Figure 1. Soil penetration resistance of two tillage methods (a: 2016; b: 2017).
Notes: Bars represent standard error (n = 3).Rotary: Rotary tilling.
Figure 2. Changes in plant height and SPAD value of maize hybrids grown by two tillage methods.
Notes: Bars represent standard error (n = 3). ** and *, significant difference at p < 0.01 and p < 0.05, respectively. ns: not significant (p < 0.05).Rotary: Rotary tilling.
Table 2. Silking day, grain yield and yield components of maize hybrids grown by two tillage methods.
Table 3. Traits of root lodging of maize hybrids grown by two tillage methods.
Figure 3. Relationships between number of root lodged plants and HPR (a) or HPR-value (b) in 2017.
Notes: ** significant difference at p < 0.01. Rotary: Rotary tilling; HPR: horizontal pulling resistance.