Figures & data
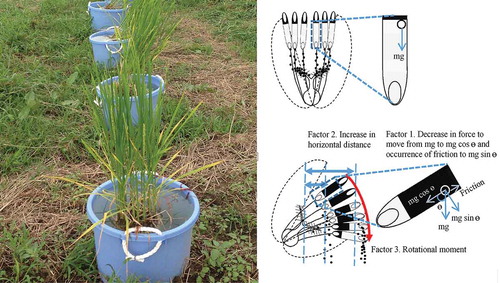
Figure 1. Inclination treatment of pot-grown rice plants.
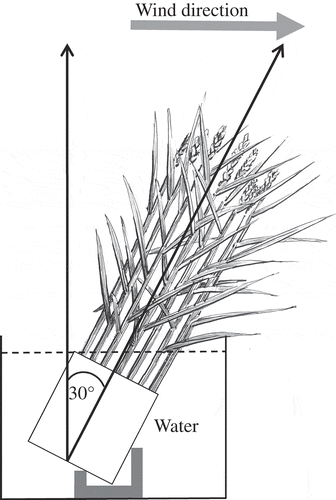
Figure 2. (a) Daily maximum and minimum temperatures during observation period, (b) RH (%) at the time of maximum temperature, and (c) average wind velocity (m s−1) around flowering time (10:00–12:00 h) during the observation period. ○ indicates sampling days and × indicates non-sampling days due to rain.
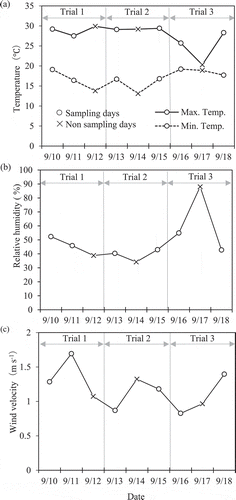
Figure 3. Exterior of dehisced anther. Anther characters were measured under a digital microscope. ADL: apical dehiscence length; ADW: apical dehiscence width; ANL: anther length; BDL: basal dehiscence length; BDW: basal dehiscence width.
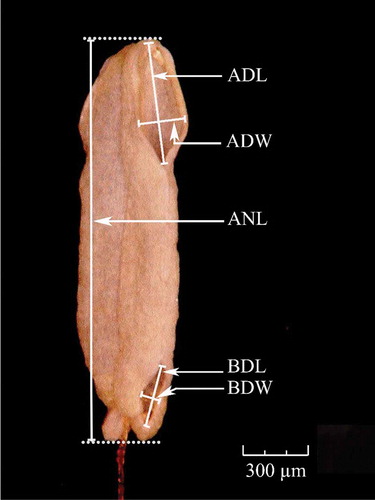
Table 1. Mean values of pollination parameters as affected by levels of panicle inclination.
Table 2. Mean values of anther characters as affected by levels of panicle inclination.
Figure 4. Relationships between average wind velocity during flowering time and (a) number of total pollen grains on the stigma, (b) logit-transformed percentage of florets with <20 total pollen grains on the stigma (TP20), and (c) logit-transformed percentage of florets with <10 germinated pollen grains on the stigma (GP10). Means are compared with the control (0°) by Dunnett’s test. *, ** and *** on lines indicate significant differences from the control and those on equations indicate significances of correlation at 5%, 1% and 0.1% levels, respectively.
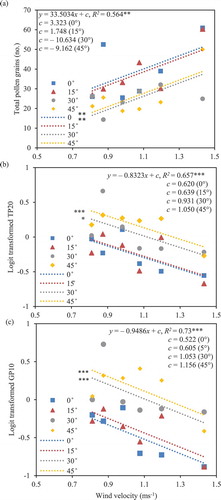
Figure 5. Relationship between logit-transformed percentages of florets with <20 total pollen grains on the stigma (TP20) and florets with <10 germinated pollen grains on the stigma (GP10). Means are compared with the control (0°) by Dunnett’s test. *** on lines indicates a significant difference from the control and that on equation indicates the significance of correlation at 0.1% level.
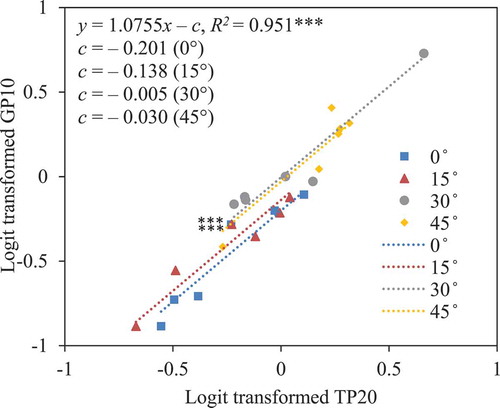
Figure 6. Schematic diagram showing possible mechanism in which the inclination reduces the pollination stability. In the erect floret (a), pollen grains easily drop out of the basal pore of the erect anther by force of gravity (mg), and filament elongation extends vertically favoring the gravity shedding of pollen grains onto stigma. In the inclined floret (b), pollination stability reduced possibly by three factors: Factor 1, decrease in force to move the pollen grains (mg cos ө) in the inclined theca and occurrence of friction to ‘mg sin ө’, which delay or obstruct the pollen release; Factor 2, increase in horizontal distance and decrease in vertical distance between anther pore and centre of stigma by elongation of filament, which reduce gravity shedding of pollens onto the stigma; and Factor 3, increasing rotational moment generated on the filament, which encourages the bending down of anthers and accelerating their inclination. Delayed pollen release increases the weight of anthers and the rotational moment. m: mass of pollen grain; g: acceleration by gravity; ө: angle of inclination with respect to vertical.
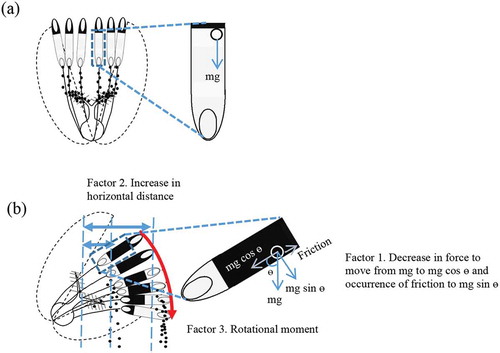
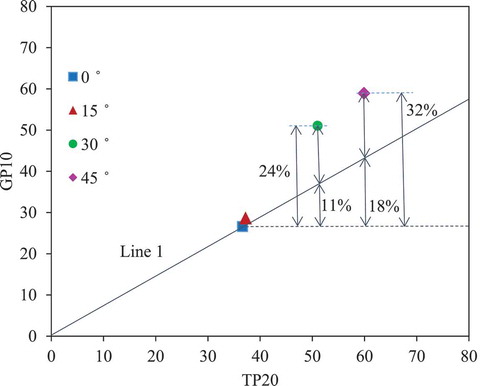
Figure 7. Factors that caused the increase in the percentage of florets with <10 germinated pollen grains (GP10) on the stigma. TP20: percentage of florets with <20 total pollen grains on the stigma. At 0°, the ratio of GP10/TP20 is 0.73. If this is the germination percentage in inclined florets, GP10 should lie on Line 1 at any given TP20. From Line 1, we can predict that an increase in TP20 would explain 11% of the 24% increase in GP10 at 30° and 18% of the 32% increase at 45°. The remaining 13% at 30° and 14% at 45° may, therefore, be due to loss of the germination ability of pollen grains on the stigma.