Figures & data
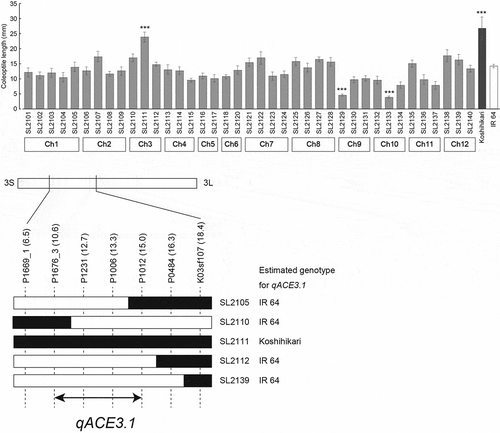
Table 1. Effects of CRATs for coleoptile elongation for Koshihikari alleles in the IR 64 genetic background.
Figure 1. Coleoptile length of chromosome segment substitution lines grown under low oxygen conditions.
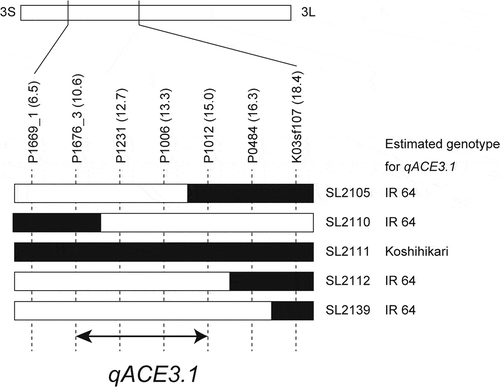
Figure 2. The candidate qACE3.1 region on chromosome 3 for coleoptile elongation under anaerobic conditions.
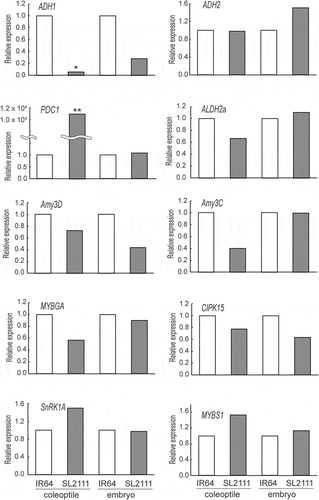
Figure 3. Comparison of gene expression levels associated with anaerobic coleoptile elongation between IR 64 and SL2111 at seven days after incubation.
Table 2. Seedling establishment of chromosome segment substitution lines in paddy fields under flooded conditions.
Supplemental material