1,087
Views
2
CrossRef citations to date
0
Altmetric
Crop Morphology

Yield and related traits for a soybean breeding line ‘Tokei 1122’ with QTLs for long terminal racemes under high planting density conditions

, , &
Pages 234-246 | Received 16 Jul 2019, Accepted 01 Mar 2020, Published online: 16 Apr 2020

Figures & data

Table 1. Daily average air temperature, solar radiation and precipitation during the growing seasons.

Figure 1. Plant shape at maturity in 2015.

TH: ‘Toyoharuka’, T22: ‘Tokei 1122ʹ* indicates row spacing, width, and number of seedlings per hill.Arrows show terminal raceme lengths.

Figure 1. Plant shape at maturity in 2015.TH: ‘Toyoharuka’, T22: ‘Tokei 1122ʹ* indicates row spacing, width, and number of seedlings per hill.Arrows show terminal raceme lengths.

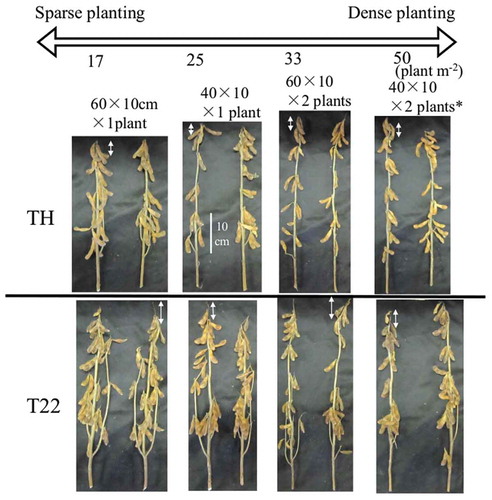
Table 2. Planting density, growth development, seed yield and related traits in 2013.

Table 3. Planting density, growth development, seed yield and related traits in 2015.

Figure 2. Effect of planting density on the seed yield, total dry matter weight, and harvest index.

(a and b) Seed yield, (c and d) total dry matter weight, and (e and f) harvest index (in 2013 and 2015, respectively).● :‘Toyoharuka’ (TH), ▲: ‘Tokei 1122ʹ (T22)†, * and ** indicate significant at the 10, 5% and 1% levels, respectively.

Figure 2. Effect of planting density on the seed yield, total dry matter weight, and harvest index.(a and b) Seed yield, (c and d) total dry matter weight, and (e and f) harvest index (in 2013 and 2015, respectively).● :‘Toyoharuka’ (TH), ▲: ‘Tokei 1122ʹ (T22)†, * and ** indicate significant at the 10, 5% and 1% levels, respectively.

Figure 3. Effect of planting density on the number of pods, number of seeds per pod, and 100-seed weight. (a and b) Number of pods, (c and d) number of seeds per pod, and (e and f) 100-seed weight (in 2013 and 2015, respectively). ●: ‘Toyoharuka’ (TH), ▲: ‘Tokei 1122ʹ (T22) †, *, and ** indicate significant at the 10%, 5%, and 1% levels, respectively.

Figure 3. Effect of planting density on the number of pods, number of seeds per pod, and 100-seed weight. (a and b) Number of pods, (c and d) number of seeds per pod, and (e and f) 100-seed weight (in 2013 and 2015, respectively). ●: ‘Toyoharuka’ (TH), ▲: ‘Tokei 1122ʹ (T22) †, *, and ** indicate significant at the 10%, 5%, and 1% levels, respectively.

Figure 4. Effect of planting density on the number of pods and number of pods per node on the main stem.

(a and b) Number of pods on the main stem and (c and d) number of pods per node on the main stem (in 2013 and 2015, respectively).●: ‘Toyoharuka’ (TH), ▲: ‘Tokei 1122ʹ (T22)† and * indicate significant at the 10% and 5% levels, respectively.

Figure 4. Effect of planting density on the number of pods and number of pods per node on the main stem.(a and b) Number of pods on the main stem and (c and d) number of pods per node on the main stem (in 2013 and 2015, respectively).●: ‘Toyoharuka’ (TH), ▲: ‘Tokei 1122ʹ (T22)† and * indicate significant at the 10% and 5% levels, respectively.

Figure 5. Relationship between terminal raceme length and the number of pods per node on the main stem.

(a) 2013 and (b) 2015●: ‘Toyoharuka’ (TH), ▲: ‘Tokei 1122ʹ (T22)* indicates significant at the 5% level.

Figure 5. Relationship between terminal raceme length and the number of pods per node on the main stem.(a) 2013 and (b) 2015●: ‘Toyoharuka’ (TH), ▲: ‘Tokei 1122ʹ (T22)* indicates significant at the 5% level.

Figure 6. Relationship between planting density and the leaf area per plant, and the relationship between the leaf area index and the seed yield.

(a and b) Relationship between planting density and the leaf area per plant and (c and d) relationship between the leaf area index and the seed yield (in 2013 and 2015, respectively).●: ‘Toyoharuka’ (TH), ▲: ‘Tokei 1122ʹ (T22)* and ** indicate significant at the 5% and 1% levels, respectively.

Figure 6. Relationship between planting density and the leaf area per plant, and the relationship between the leaf area index and the seed yield.(a and b) Relationship between planting density and the leaf area per plant and (c and d) relationship between the leaf area index and the seed yield (in 2013 and 2015, respectively).●: ‘Toyoharuka’ (TH), ▲: ‘Tokei 1122ʹ (T22)* and ** indicate significant at the 5% and 1% levels, respectively.