Figures & data
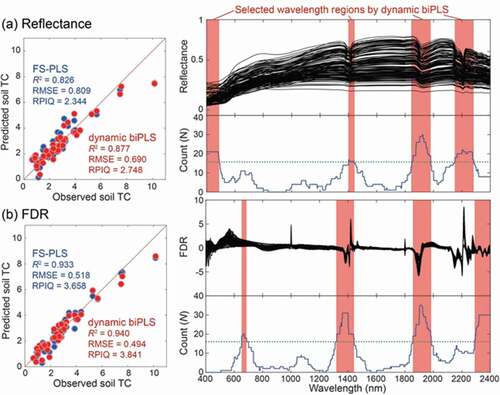
Figure 1. Location of study area and soil sampling points. Source for background images in (a), (b) and (d): Esri, DigitalGlobe, GeoEye, Earthstar Geographics, CNES/Airbus DS, USDA, USGS, AeroGRID, IGN, and the GIS User Community
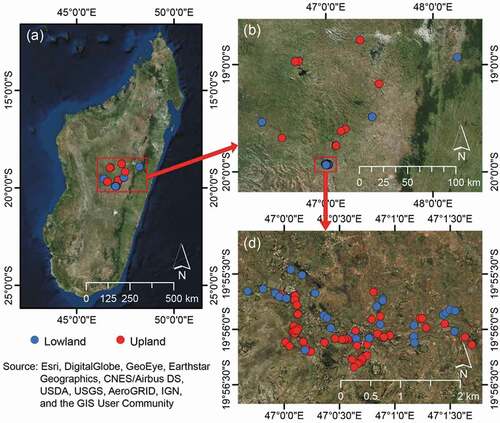
Table 1. Descriptive statistics of soil TC data
Figure 2. (a) Box-and-whiskers plot with outliers and (b) a histogram of soil TC
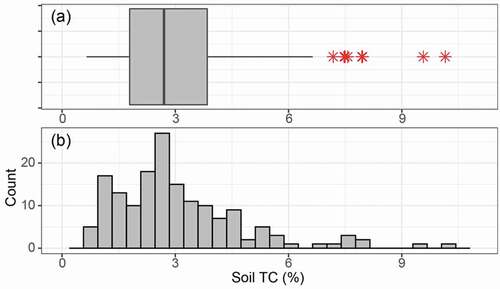
Figure 3. Raw reflectance spectra (a) and FDR spectra on a log10 scale (b) of the soil samples
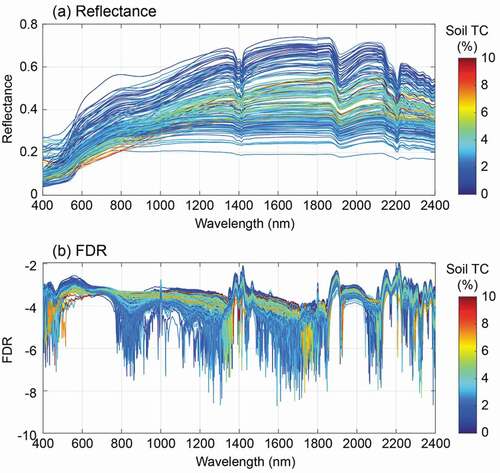
Table 2. Selected wavelength regions from dynamic biPLS for estimating the soil TC content using reflectance and FDR data sets and possible soil components
Figure 4. Selected wavelength regions (red bars) from dynamic biPLS for estimating the TC content of paddy soils using reflectance (a) and FDR (b) spectra with the frequencies (count number (N); blue line) of the selected wavebands in dynamic biPLS. Specific absorption bands for the different bonds in soil are specified in the top x-axis (modified by Katuwal et al. (Citation2018))
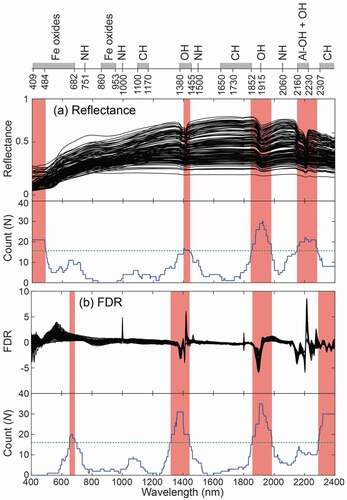
Table 3. The mean R2 and RMSE from the 5-fold cross-validation using the training data sets based on PLS analyses and the R2, RMSE and RPIQ based on the model applied to the test data sets
Figure 5. Observed and predicted soil TC contents from the FS-PLS (blue) and dynamic biPLS (red) models using original reflectance (a) and FDR (b) data