Figures & data
Figure 1. Expression of RbcS and kinetic properties of Rubisco. (a) Expression of RbcS. Soluble proteins (6.4 μg) extracted from leaves were separated by 14% SDS-PAGE and stained by Coomassie blue. Fractions around RbcL (upper panel) and RbcS (lower panel) are shown. (b) Kinetic properties of Rubisco. kcat, Kc and Sc/o values are the means ± SE of 4–5 biological replicates. Different letters above the bars indicate significant difference (P < 0.05) between lines determined by Tukey’s test. WT, non-transgenic rice; SS10, sorghum RbcS overexpression line; iSS4 and iSS5; double-transgenic lines expressing sorghum RbcS with RbcS knockdown by RNAi
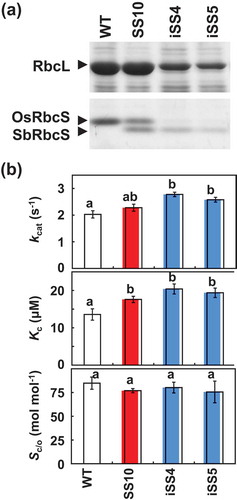
Figure 2. Rubisco, total soluble protein, chlorophyll and nitrogen contents. Uppermost fully expanded leaves (10th leaf blade at 10.5 leaf stage) were used for experiments. Data represent the mean ± SD of five biological replicates. Different letters above the bars indicate significant difference (P < 0.05) between lines determined by Tukey’s test
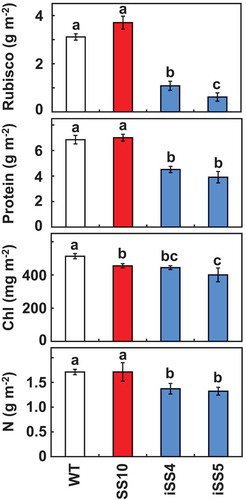
Figure 3. Photosynthetic rate under different CO2 partial pressures. The CO2 assimilation rates are shown based on the leaf area (a) and nitrogen content (b). The CO2 assimilation rates of uppermost fully expanded leaves (10th leaf blade at 10.5 leaf stage) were measured at a photon flux density of 1,500 μmol m−2 s−1, leaf temperature of 28°C and CO2 partial pressures of 14, 38 and 88 Pa. Data represent the mean ± SD of four biological replicates. Different letters above the bars indicate significant difference (P < 0.05) between lines determined by Tukey’s test
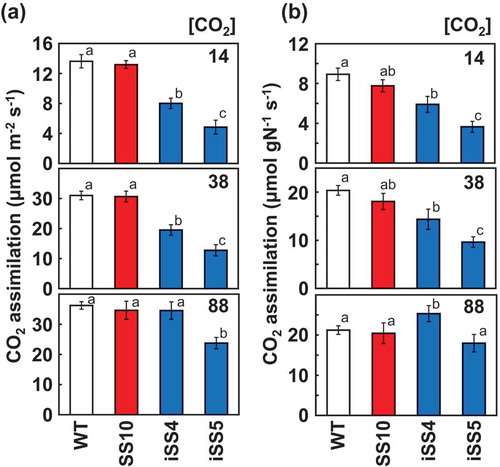
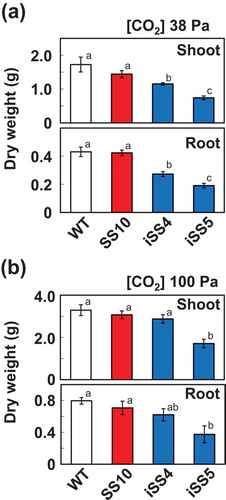
Figure 4. Shoot and root dry weights of plants grown under different CO2 levels. Rice plants were grown under CO2 partial pressures of 38 Pa (a) and 100 Pa (b). Shoot and root dry mass were determined at 30 days after germination. Different letters above the bars indicate significant difference (P < 0.05) between lines determined by Tukey’s test