Figures & data
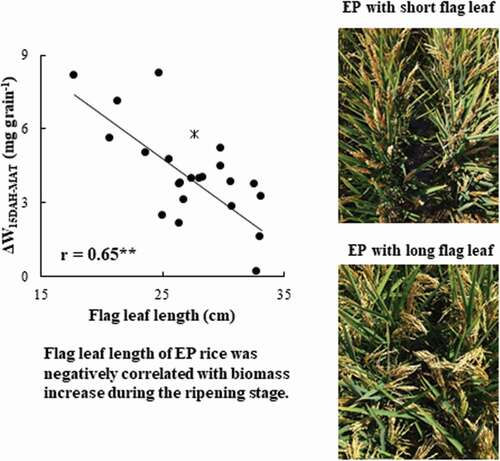
Table 1. Daily average temperature and solar radiation during the rice growth periods in 2015 and 2016
Table 2. Yield, yield components, and agronomic traits of two rice progenitors and the erect panicle (EP) and non-erect panicle (nEP) type of RILs in 2015
Table 3. Pearson partial correlation coefficients for yield, yield components, and agronomic traits of 23 EP RILs and 35 nEP RILs in 2015
Figure 1. Relationship between the flag leaf length (cm) and (a) sink capacity (g m−2) and (b) source amount (mg grain−1) in EP RILs in 2015. * represents Liaojin5, an EP progenitor.
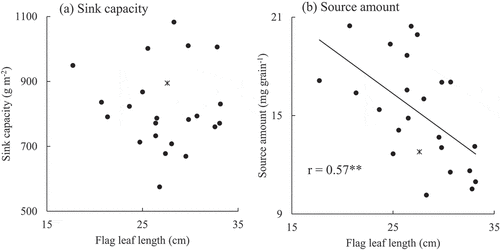
Figure 2. Relationship between the flag leaf length and the (a) non-structural carbohydrates in stems per grain at heading (NSC, mg grain−1), (b) biomass increase per grain from heading to 15 days after heading (∆WHD-15DAH, mg grain−1), and (c) biomass increase per grain from 15 days after heading to maturity (∆W15DAH-MAT, mg grain−1) in EP RILs in 2015. * represents Liaojin5, an EP progenitor.
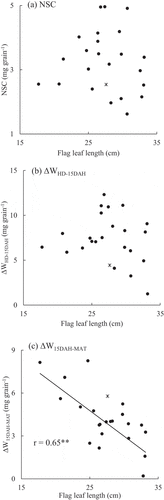
Table 4. Yield, yield components, and agronomic traits of two rice progenitors and the erect panicle (EP) type of RILs in 2016
Table 5. Averages and the results of ANOVA for the leaf area index (LAI) distribution parameters: mean LAI distribution (a1) and the variance of LAI distribution (a2) in the heading stage, and at 15 and 30 days after heading (15 DAH and 30 DAH, respectively)
Table 6. Averages and the results of ANOVA for SPAD values of first, second, and third upper leaves at 7, 14, 28 days after heading (7 DAH, 14 DAH, and 28 DAH, respectively) and SPAD decline rate (7DAH to 28DAH)