Figures & data
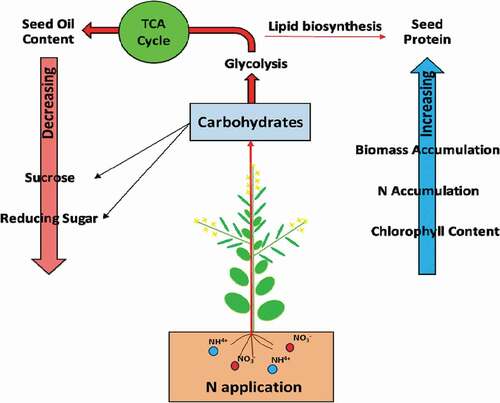
Figure 1. Monthly rainfall and the mean temperature during the growing seasons 2018–2020 from September- May.
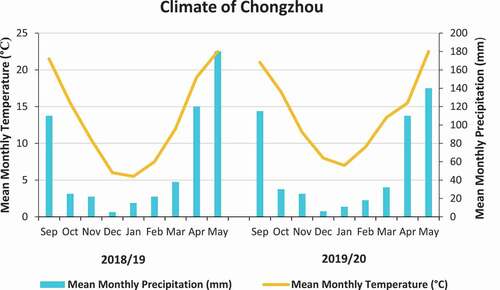
Table 1. Effect of different nitrogen rates (N0=0kg N ha−1; N90=90kg N ha−1; N180=180kg N ha−1) on morphological parameters of two varieties (V1=JYJS01 (semi-dwarf), and V2=CY36 (tall height) of rapeseed during the growing periods of 2018/19 and 2019/20
Figure 2. Effect of different nitrogen application rates, N0 = 0 kg N ha−1(control); N90 = 90 kg N ha−1; N180 = 180 kg N ha−1 at vegetative, flowering, and pod filling stage on plant height of two varieties, (a) V1 = JYJS01 (semi-dwarf), and (b) V2 = CY36 (tall height) in the years of 2018/19 and 2019/20. The ns, *, ** and *** represent the non-significant, significant at P < 0.05, 0.01, 0.001, respectively. Values on the bars followed by the same letter are not significantly different at P < 0.05 as determined by the LSD test; n = 3.
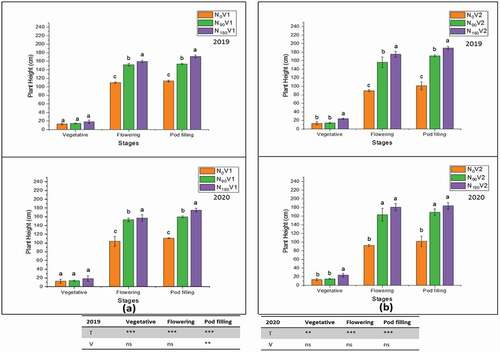
Figure 3. Effect of different nitrogen application rates, N0 = 0 kg N ha−1(control); N90 = 90 kg N ha−1; N180 = 180 kg N ha−1 on the biomass accumulation of two varieties, (a) V1 = JYJS01 (semi-dwarf), and (b) V2 = CY36 (tall height) at vegetative, flowering, pod filling stage and maturity stage The ns, *, ** and *** represent the non-significant, significant at P < 0.05, 0.01, 0.001, respectively. Values on the bars followed by the same letter are not significantly different at P < 0.05 as determined by the LSD test; n = 3.
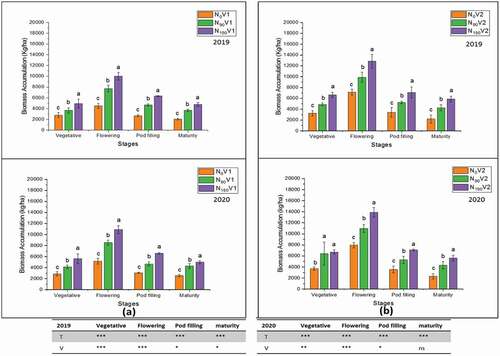
Figure 4. Effect of different nitrogen treatments, N0 = 0 kg N ha−1(control); N90 = 90 kg N ha−1; N180 = 180 kg N ha−1 at vegetative, flowering and pod filling stage on leaf chlorophyll content of two varieties, (a) V1 = JYJS01 (semi-dwarf), and (b) V2 = CY36 (tall height) during the years of 2018/19 and 2019/20. The ns, *, ** and *** represent the non-significant, significant at P < 0.05, 0.01, 0.001, respectively. Values on the bars followed by the same letter are not significantly different at P < 0.05 as determined by the LSD test; n = 3.
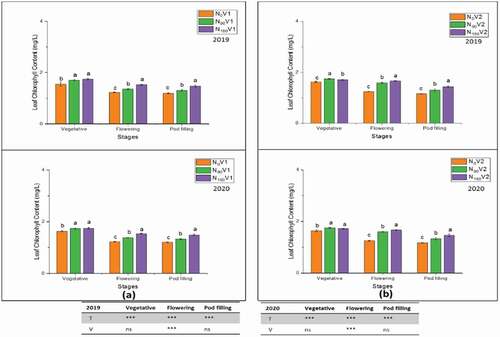
Figure 5. Effect of different nitrogen treatments, N0 = 0 kg N ha−1(control); N90 = 90 kg N ha−1; N180 = 180 kg N ha−1 at flowering and pod filling stage on pod wall chlorophyll content of two varieties, (a) V1 = JYJS01 (semi-dwarf), and (b) V2 = CY36 (tall height) during the years of 2018/19 and 2019/20. The ns, *, ** and *** represent the non-significant, significant at P < 0.05, 0.01, 0.001, respectively. Values on the bars followed by the same letter are not significantly different at P < 0.05 as determined by the LSD test; n = 3.
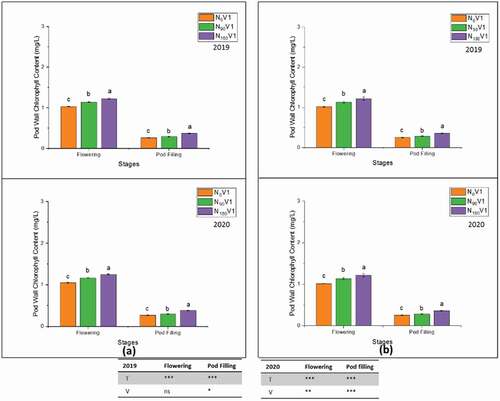
Figure 6. Effect of different nitrogen application rates, N0 = 0 kg N ha−1(control); N90 = 90 kg N ha−1; N180 = 180 kg N ha−1 at vegetative, flowering and pod filling stage on leaves nitrogen percentage of two varieties, (a) V1 = JYJS01 (semi-dwarf), and (b) V2 = CY36 (tall height) during the years of 2018/19 and 2019/20. The ns, *, ** and *** represent the non-significant, significant at P < 0.05, 0.01, 0.001, respectively. Values on the bars followed by the same letter are not significantly different at P < 0.05 as determined by the LSD test; n = 3.
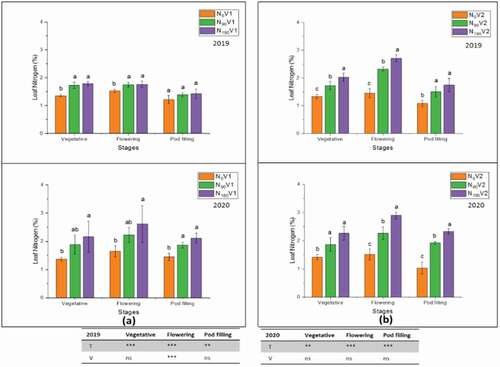
Figure 7. Stem nitrogen percentage at different nitrogen treatments, N0 = 0 kg N ha−1(control); N90 = 90 kg N ha−1; N180 = 180 kg N ha−1 at vegetative, flowering, pod filling and maturity stage and on varieties, (a) V1 = JYJS01 (semi-dwarf), and (b) V2 = CY36 (tall height) in the years of 2018/19 and 2019/20. The ns, *, ** and *** represent the non-significant, significant at P < 0.05, 0.01, 0.001, respectively. Values on the bars followed by the same letter are not significantly different at P < 0.05 as determined by the LSD test; n = 3.
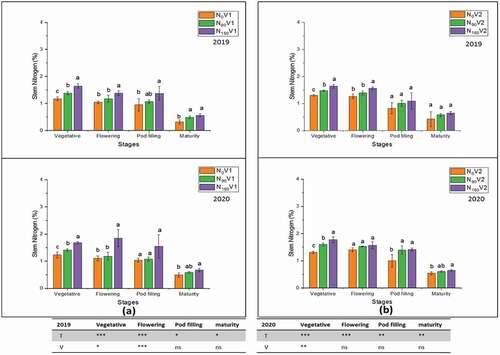
Figure 8. Effect of different nitrogen application rates, N0 = 0 kg N ha−1(control); N90 = 90 kg N ha−1; N180 = 180 kg N ha−1 on pod wall and seed nitrogen percentage of two varieties, (a) V1 = JYJS01 (semi-dwarf), and (b) V2 = CY36 (tall height) at maturity stage in the years of 2018/19 and 2019/20. The ns, *, ** and *** represent the non-significant, significant at P < 0.05, 0.01, 0.001, respectively. Values on the bars followed by the same letter are not significantly different at P < 0.05 as determined by the LSD test; n = 3.
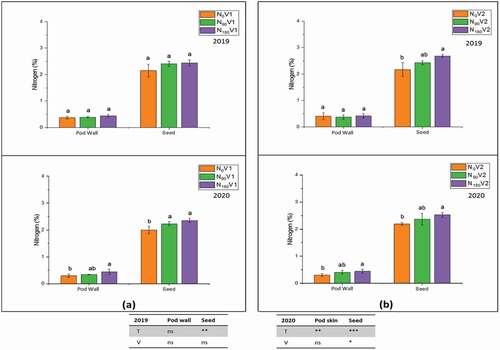
Table 2. The consequence of different nitrogen treatments, N0=0kg N ha−1; N90=90kg N ha−1; N180=180kg N ha−1) and varieties, V1 = JYJS01 (semi-dwarf) and V2 = CY36 (tall height) in rapeseed on oil content, protein, glucosinolate, erucic acid and fatty acid composition during the growing seasons of 2018/19 and 2019/20
Table 3. Effect of different nitrogen rates (N0=0kg N ha−1; N90=90kg N ha−1; N180=180kg N ha−1) on stem sugars (Sucrose and reducing sugar contents) of two varieties (V1=JYJS01 (semi-dwarf), and V2=CY36 (tall height) of rapeseed during the flowering and pod filling periods of 2018/19 and 2019/20
Table 4. Effect of different nitrogen rates (N0=0kg N ha−1; N90=90kg N ha−1; N180=180kg N ha−1) on pod wall sugars (Sucrose and reducing sugar contents) of two varieties (V1=JYJS01 (semi-dwarf), and V2=CY36 (tall height) of rapeseed during the flowering and pod filling periods of 2018/19 and 2019/20
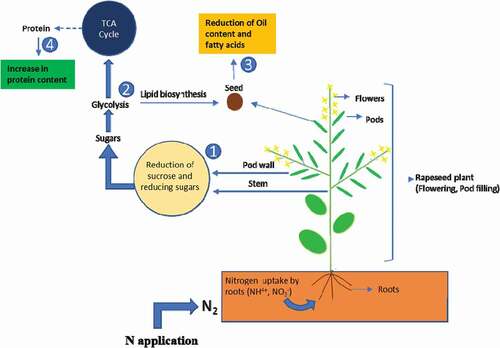
Figure 9. This figure shows that the high nitrogen application rate had caused a reduction of stem and pod wall sugars: sucrose and reducing sugars (1), which had caused their reducibility for glycolysis (2). This reduction is responsible for the happenings of two significant events. The first one is the decreased production of oil contents (3) and fatty acids and the second event is the enhancement in the protein contents (4). The TCA represents the Tricarboxylic acid cycle.