Figures & data
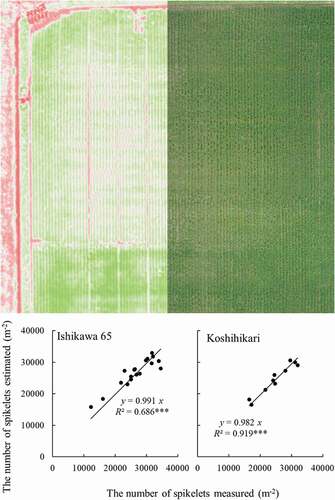
Table 1. Dates of transplanting, heading, levels nitrogen (N) application rate, and levels of transplanting density in each year in each cultivar
Table 2. Vegetation indices (VIs), their equations and references
Figure 1. A schematic image of harvested area.
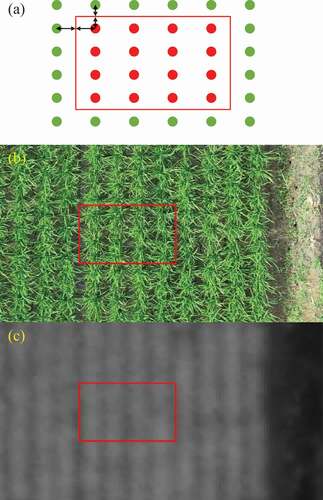
Table 3. Semimonthly daily mean temperature and cumulative solar radiation (MJ m−2) from the first half of May to the first half of August
Figure 2. Relations between plant nitrogen content and vegetation indices (VIs). The closed circles denote Isihkawa 65 and the open Koshihikari. Lines correspond the best fit function. n = 108.
Figure 3. Relations between CIG15 and the number of spikelets in Ishikawa 65 and Koshihikari. The closed circles denote 2019 and the open 2020. ***Significant at 0.001 level (n = 54 in Ishikawa 65; n = 30 in Koshihikari).
Table 4. Cumulative solar radiation (MJ m−2) in the 15-day period before heading at each plot
Table 5. Multiple regression analysis with the number of spikelets per unit area as a dependent variable and CIG15 and CSR15 as independent variables
Figure 4. Relations between the number of spikelets measured and that estimated in Ishikawa 65 and Koshihikari. ***Significant at 0.001 level (n = 18 in Ishikawa 65; n = 10 in Koshihikari).