Figures & data
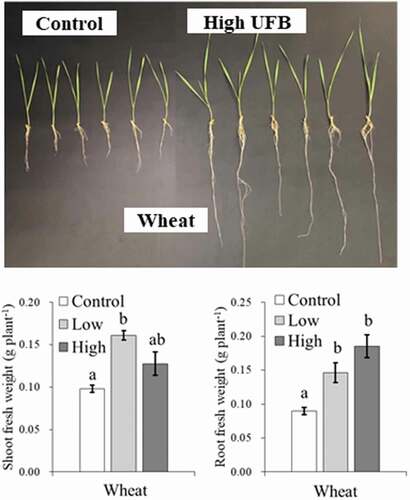
Figure 1. Bubble size distribution in de-ionized water (control), in water containing two levels of UFBs (Low, 2.23x10⁷ ml−1; High, 7.07x10⁷ ml−1). The tracking motion picture recorded every 30 s and distributions were calculated using Nanosight LM10. Bubble size distribution was measured three times for each condition, and the average values are provided.
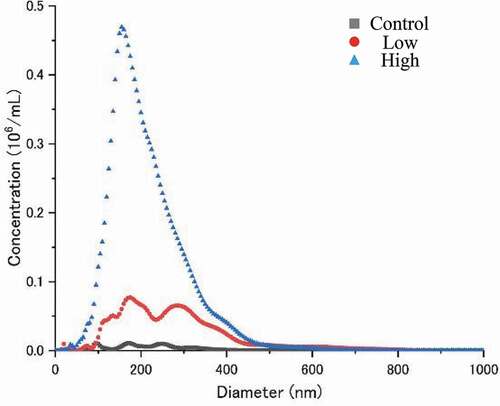
Figure 2. Images of wheat seedlings grown in the control non-UFB water (nUFB) and higher concentration (7.07x10⁷ ml−1) UFB water (UFB) with zero nutrients (12 days after seeding).
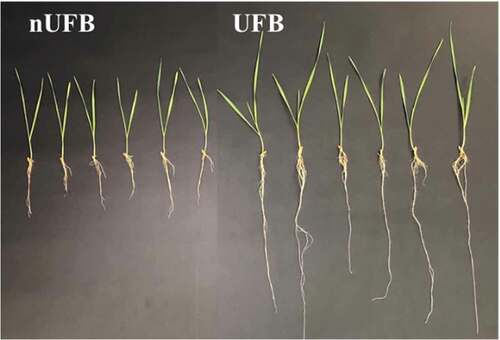
Figure 3. Biomass production of six crop species for the control (de-ionized water), low (2.23x10⁷ ml−1), and high (7.07x10⁷ ml−1) UFB concentrations under zero and full nutrient levels. Data are means ± standard error (SE) (n = 6). Means followed by the same lowercase letter were not significantly different at P < 0.05, according to Tukey-Kramer multiple comparison test.
Figure 4. Elongation growth of six crop species among control (de-ionized water), low (2.23x10⁷ ml−1), and high (7.07x10⁷ ml−1) UFB concentrations under zero and full nutrient levels. Data are means ± standard error (SE) (n = 6). Means followed by the same lowercase letter were not significantly different at P < 0.05, according to Tukey-Kramer multiple comparison test.