Figures & data

Figure 1. Rolling in the experimental field (7 December 2018).
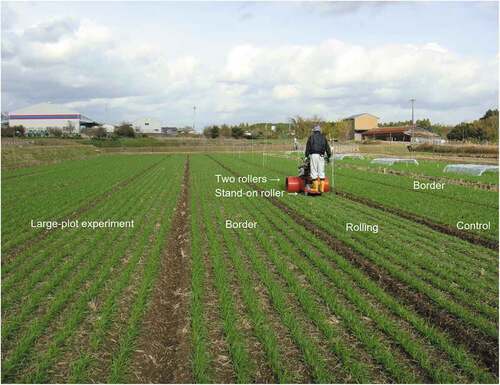
Table 1. Calendar dates of sowing, rolling, and ethephon spraying.
Figure 2. Time course of apical development in (a) 2018–19 and (c) 2019–20, and regression analysis between apical development stage and thermal time in (b) 2018–19 and (d) 2019–20.
‘R1’ and ‘R2’ indicate the first and second rollings (see, ). ns, not significant; *P < 0.05; **P < 0.01 (t-test, n = 30). Apical development stages 2–10 equate to those of Inamura et al. (Citation1955) as follows: 2 = V (spikelet primordia cannot be observed). 3 = VI (spikelet primordia, which can be seen as double ridges, initiate in the middle of the spike). 4 = VIIe (spikelet primordia initiate at the base of the spike). 5 = VIIl (double ridges become less distinct). 6 = VIII (spikelet primordia begin to differentiate empty glumes, and the terminal spikelet initiates). 7 = IXe (spikelet primordia differentiate into florets). 8 = IXm (first florets differentiate into lemma, palea, stamen, and pistil). 9 = IXl (all florets differentiate into lemma, palea, stamen, and pistil). 10 = X (empty glume and awn begin to elongate).
Table 2. Calendar dates of spikelet initiation, start of internode elongation, and jointing stages in rolling treatment and control estimated from regression analysis.
Table 3. Means heading and maturity dates; score of frost injury; lengths of spike and culm; and yield.
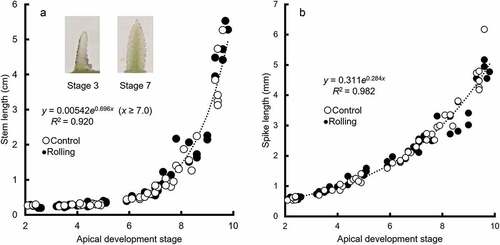
Figure 3. Relationships of apical development stage with (a) stem length and (b) spike length (pooled data of 2018–19 and 2019–20).
Supplemental material