Figures & data
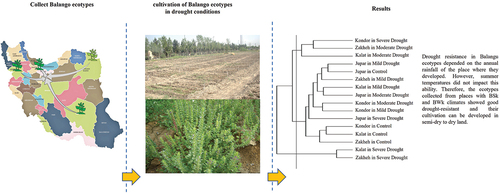
Figure 1. Monthly change of minimum and maximum temperatures and rainfall rates in 2015 and 2016.
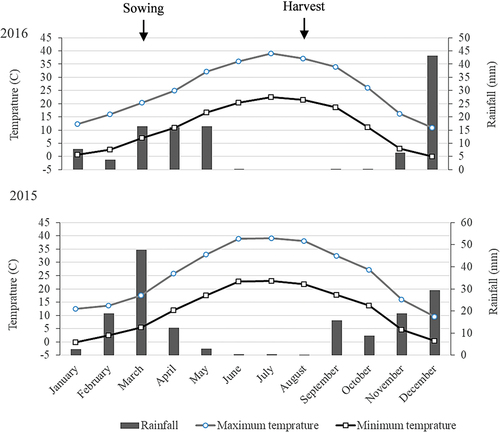
Table 1. Specifications of Balangu ecotypes collection areas.
Table 2. Soil physicochemical properties of experimental farm at 2015 and 2016.
Figure 2. The drought impact on the dry weight (a), seed yield (b), leaf numbers (c), plant height (d), and HI (e) of various Lallemantia royaleana ecotypes. Values are means (n = 6). Circle = Kalat ecotype, triangle = Kondor ecotype, rectangle = Jupar ecotype, and diamond = Zakheh ecotype.
Figure 3. The drought impact on RWC of various Lallemantia royaleana ecotypes. Values are means (n = 3). Means with the same letter have no significant difference at p ≤ 0.05.
Table 3. Mean comparison of Lallemantia royleana growth features at different drought stress and ecotype.
Figure 4. The effect of drought stress on the seed oil content of various ecotypes (a) and omega −6 content (b), and the content change of omega-6 (c) and the α-linolenic acid (c) in different ecotypes in 2015 and 2016. Values are means for seed oil content (n = 6), α-linolenic acid and omega-6 content (n = 3). Different alphabet characters indicate significant differences (p ≤ 0.05), determined by Duncan test.
Figure 5. Change of protein (a), phenol (c), and soluble carbohydrate (d) contents in response to drought stresses in the various ecotypes. Values are means (n = 6).
Table 4. Mean comparison of Lallemantia reoyleana biochemical characteristics at different drought stress and ecotype.
Figure 6. Antioxidant enzyme activity response to drought stress in the various ecotypes. a: CAT activity; b: APX activity; c: SOD activity; d: POD activity. Values are means (n = 6). Circle = Kalat ecotype, triangle = Kondor ecotype, rectangle = Jupar ecotype, and diamond = Zakheh ecotype.
Figure 7. Photosynthesis pigments content response to drought stress in the various ecotypes. Values are means(n = 6). Circle = Kalat ecotype, triangle = Kondor ecotype, rectangle = Jupar ecotype, and diamond = Zakheh ecotype.
Table 5. Mean comparison of Lallemantia reoyleana pigments at different drought stress and ecotype.
Figure 8. Heatmap hierarchical clustering and biplot PCA of morpho-physiological and biochemical features of various Lallemantia royleana ecotypes under drought stress. Z-score is shown the values of standardized means for each row from low (blue) to high (red).
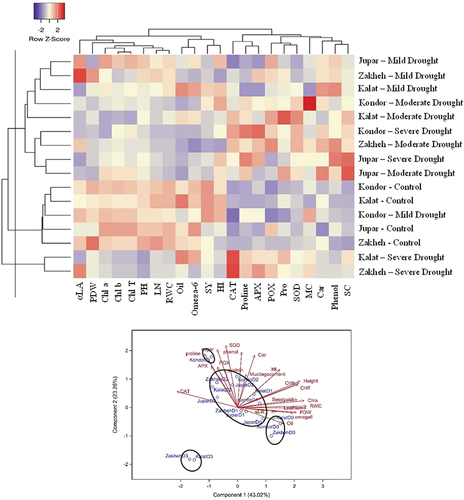
Table 6. Pearson correlation coefficients of measured traits under various irrigation regimes.