Figures & data
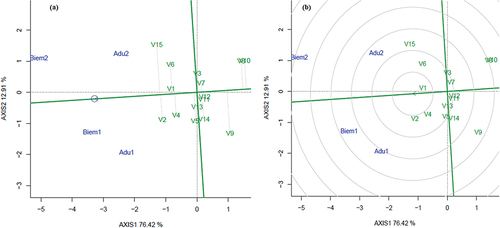
Table 1. Initial physico-chemical properties of soils in the experimental sites.
Figure 1. Rainfall amount during the major (a) and minor (b) seasons.
Table 2. Characteristics of improved rice varieties evaluated.
Table 3. P-values from the analysis of variance on growth and yield parameters for rice varieties for each season.
Table 4. Growth and yield performance of rice varieties in the Makran watershed during 2020–2021.
Figure 2. Grain yield performance of improved varieties at the study locations for two cropping seasons. .
Figure 3. The ‘which-won-where’ view of the GGE biplot based on the variety × location data in .
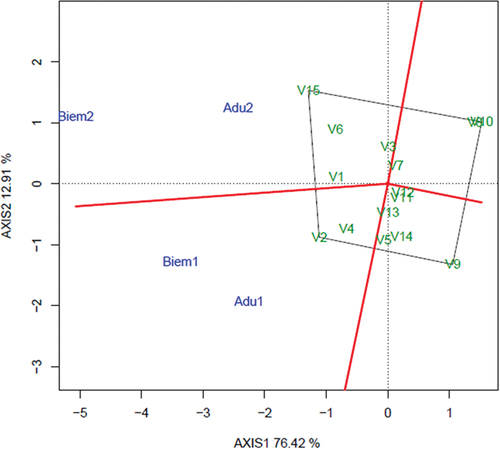
Figure 4. Mean verses stability (a) and variety-focused scaling (b) for comparing improved varieties and local checks. .

Figure 5. Farmers’ preference for newly introduced improved rice varieties compared to local checks in the Mankran watershed in Ghana.
Data availability statement
The data presented in this study are available on request from the corresponding author. The data are not publicly available for ethical reasons.