Figures & data
Table 1. Transplanting and heading dates, N levels, transplanting density and number of plots per planting date in Koshihikari and Ishikawa 65.
Figure 1. Percentages of BBWG, MWG, OTG, and perfect grains averaged over plots in each cropping in Koshihikari and Ishikawa 65.
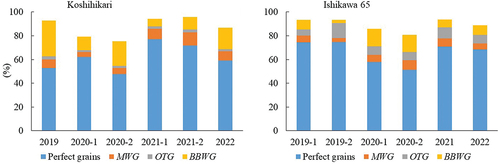
Figure 2. Relations between CIG0, T +20, or R−20 and BBWG in Koshihikari and Ishikawa 65.
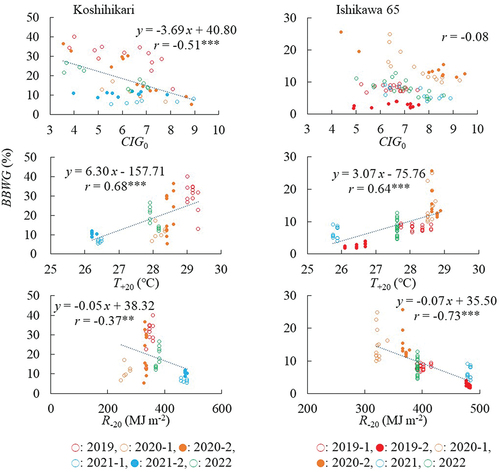
Figure 3. Relations between CIG0, T +20, or R−20 and MWG in Koshihikari and Ishikawa 65.
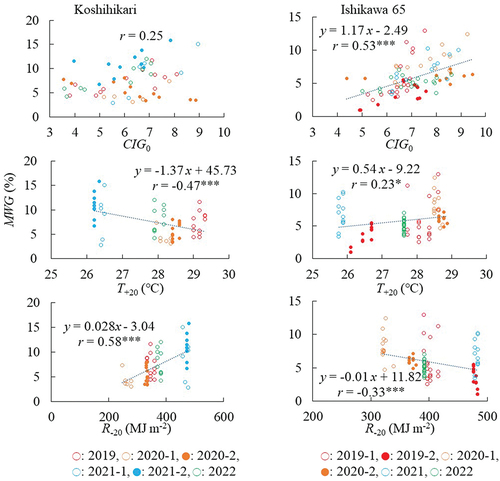
Figure 4. Relations between CIG0, T +20, or R−20 and OTG in Koshihikari and Ishikawa 65.
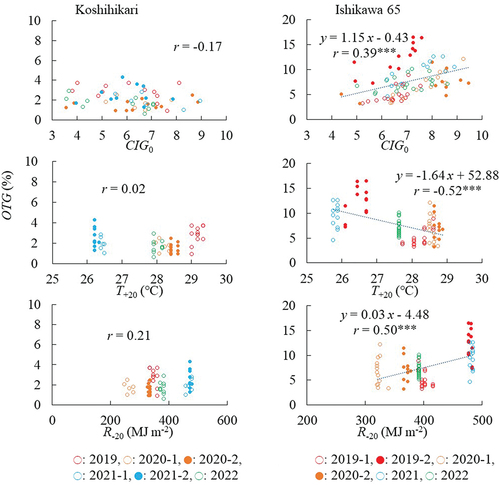
Figure 5. Relations between CIG0, T +20, or R−20 and GPC in Koshihikari and Ishikawa 65.
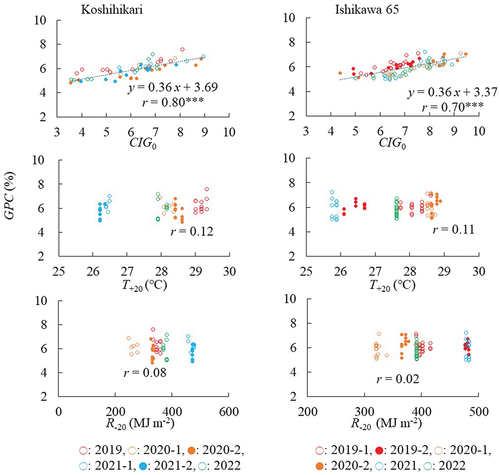
Table 2. Multiple regression analysis with BBWG, MWG, OTG, and GPC as dependent variables and CIG0, R−20, and T +20 are independent variables.
Figure 6. Relations between observed and estimated BBWG, MWG, OTG, and GPC in Koshihikari and Ishikawa 65.
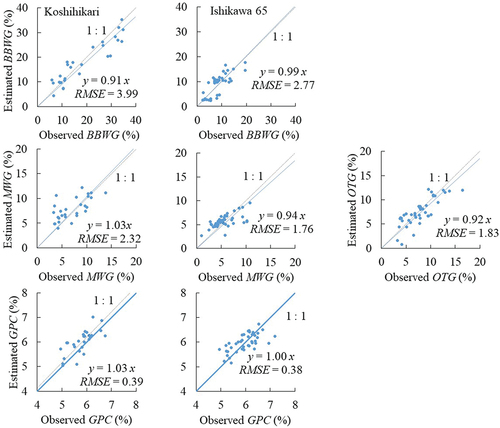
Figure 7. Estimated BBWG, MWG, OTG, and GPC at the mean T +20 and R-20 in the last 10 years.
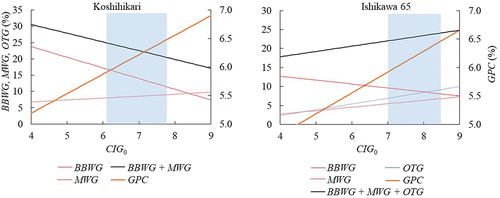
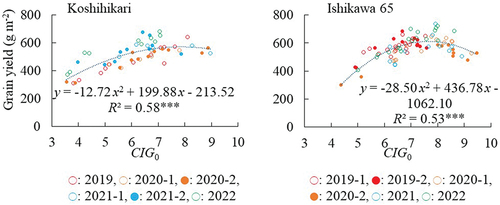
Figure 8. Relations between CIG0 and grain yield in Koshihikari and Ishikawa 65.