Figures & data
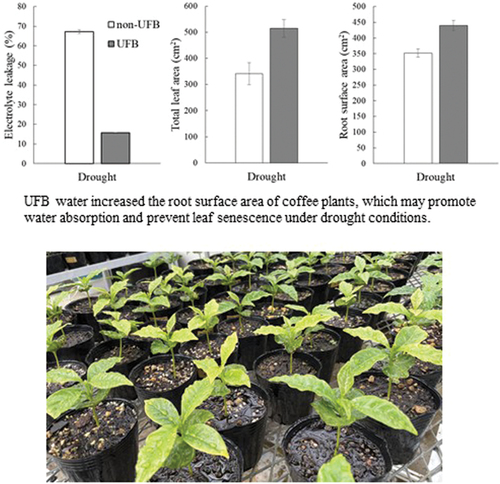
Table 1. Details of treatments and environments in the six experiments.
Table 2. Plant height (cm) increase, and dry weight (DW; g plant−1) of both shoot and root in experiment 1.
Table 3. Plant height (cm) increase, and dry weight (DW; g plant−1) of shoot, leaf, and root in experiment 2.
Table 4. Plant height (cm) increase, and dry weights (DW; g plant−1) of shoot, leaf, and root in experiment 3.
Figure 1. Electrolyte leakage of coffee leaf disks in experiment 4. Data are means of four plant samples in each treatment. Vertical bars indicate standard errors (n = 4). Note:** indicates significance at 1% probability, ‘ns’ indicates non-significance. Student’s t-test was performed for the comparison between non-UFB and UFB.
Table 5. Plant height (cm) increase, and dry weight (DW; g plant−1) of shoot, leaf, and root in experiment 4.
Table 6. Leaf number (LN; plant−1), individual leaf area (ILA; cm2), total leaf area (TLA; cm2), specific leaf area (SLA; cm2 g−1), total root length (TRL; cm plant−1), root surface area (RSA; cm2 plant−1), and specific root length (SRL; cm g−1) in experiment 4.