Figures & data

Table 1. Maize cultivars for the experiment.
Figure 1. Meteorological conditions in ginger growing period.
Figure 2. Field layout of different row spacing intercropping patterns.
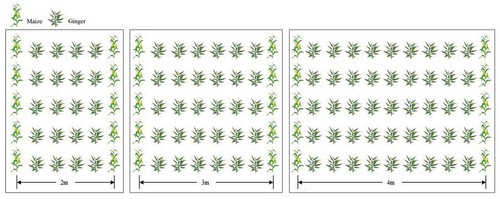
Figure 3. Differences in soil temperature in different treatments.
ST, shading treatment; CK, pure without shading. Values with different lowercase letters are significantly different with p < 0.05 according to the least significant difference test.
Table 2. Variance analysis of soil and canopy indexes.
Figure 4. Differences in soil moisture content in different treatments.
ST, shading treatment; CK, pure without shading. Values with different lowercase letters are significantly different with p < 0.05 according to the least significant difference test.
Figure 5. Diurnal variation in canopy temperature under different treatments.
A1, ZH 311-2 m; A2, ZH 311-3 m; A3, ZH 311-4 m; B1, ZH 6-2 m; B2, ZH 6-3 m; B3, ZH 6-4 m; ST, shading treatment; CK, pure without shading.
Figure 6. Diurnal variation in canopy humidity under different treatments.
A1, ZH 311-2 m; A2, ZH 311-3 m; A3, ZH 311-4 m; B1, ZH 6-2 m; B2, ZH 6-3 m; B3, ZH 6-4 m; ST, shading treatment; CK, pure without shading.
Figure 7. Shading rate of ginger in different treatments.
A1, ZH 311-2 m; A2, ZH 311-3 m; A3, ZH 311-4 m; B1, ZH 6-2 m; B2, ZH 6-3 m; B3, ZH 6-4 m; ST, shading treatment; CK, pure without shading. Values with different lowercase letters are significantly different with p < 0.05 according to the least significant difference test.
Table 3. Morphological indices and ginger yield under different intercropping patterns.
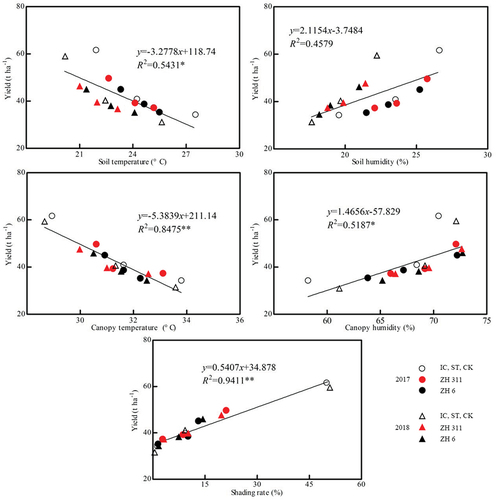
Figure 8. Correlation analysis between field microclimate and ginger yield.