Figures & data
Figure 1. Effects of three different P-application treatments on the number of tillers (a, b), shoot biomass (c, d), and P-content in shoots (e, f) in 2021 and 2022 among”Takanari,” NIL-MP3, and NIL-fc1. *, **, and *** indicate significant effects and interactions between P-application method (P) and genotype (G) at the 5%, 1%, and 0.1% levels, respectively. Different letters represent significant differences among genotypes across P-application treatments at the 5% level based on Tukey’s honestly significant difference test. Error bars represent standard deviation.
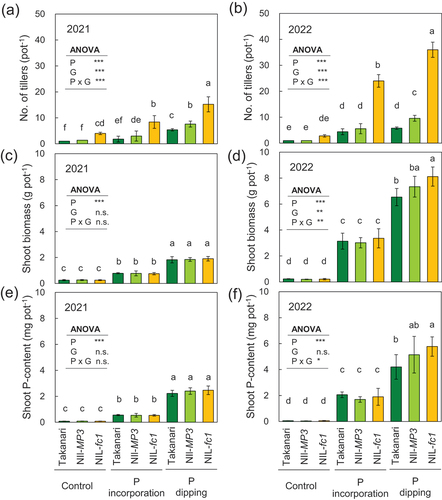
Table 1. Two-way ANOVA for root-related traits at 25 and 39 days after transplantation in 2021 and 2022, respectively, in”Takanari,” NIL-MP3, and NIL-fc1 grown in the pots with the three P-application treatments.
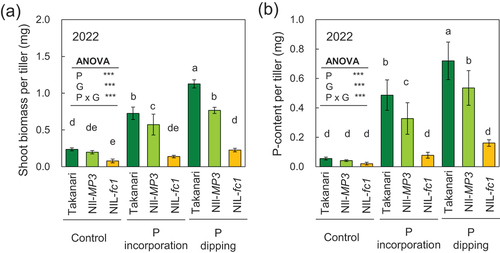
Figure 2. Effects of three different P-application treatments on shoot biomass per tiller (a) and P-content per tiller (b) in 2022 among”Takanari,” NIL-MP3, and NIL-fc1. *** indicates significant effects and interactions between P-application method (P) and genotype (G) at the 0.1% level. Different letters represent significant differences among genotypes across P-application treatments at the 5% level based on Tukey’s honestly significant difference test. Error bars represent standard deviation.