
Figures & data
Figure 1. Aged population growth rate (65 years old or older) %, (Korean statistical information service Citation2018).
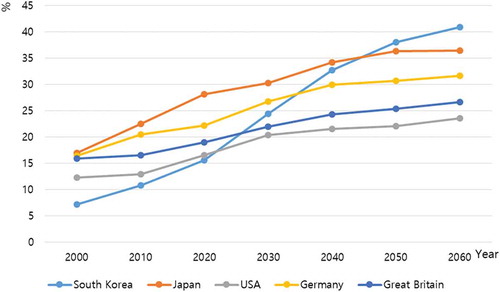
Figure 2. 3 factors of active aging.
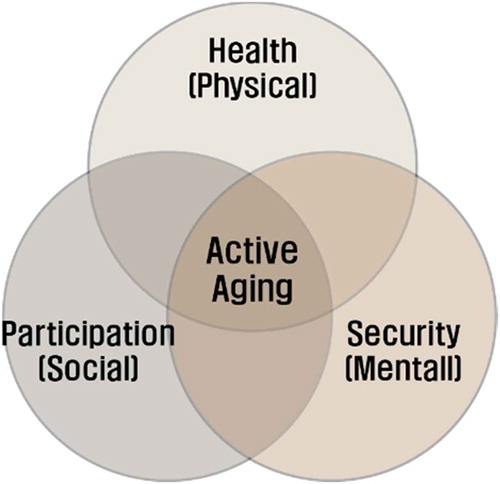
Figure 3. Examples diagram of smart home.
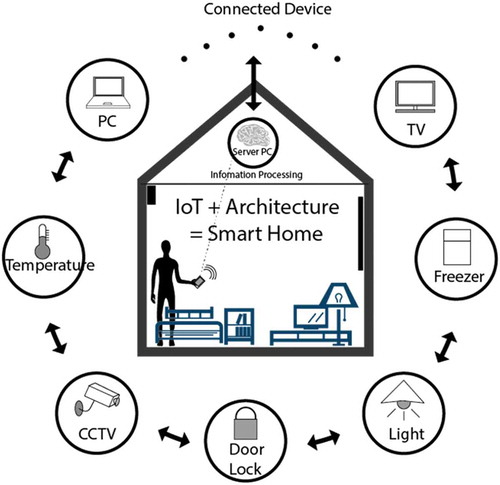
Figure 4. Example diagram of daily healthcare devices.
Figure 5. Example diagram of AAL healthcare platform.
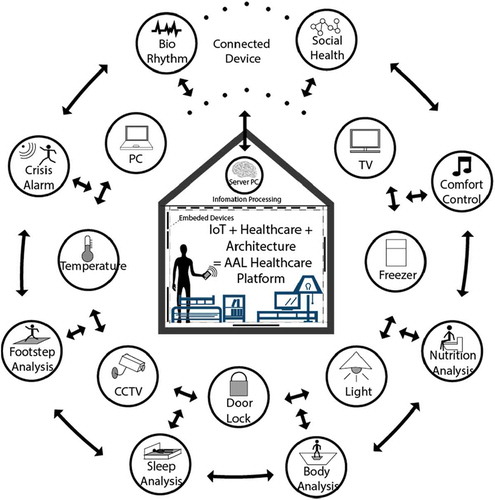
Table 1. Summary of elderly’s characteristics.
Table 2. AAL exemplar cases for each residential space.