Figures & data
Table 1. Subjects’ socio-demographic data.
Table 2. Informal break and work task ratios.
Table 3. Data collection method for variables used in this study.
Table 4. Sample of the data used for conducting the multilinear regression analysis.
Table 5. Regression Statistics.
Table 6. Summary of the ANOVA results.
Table 7. Regression coefficients.
Figure 1. Dimensional model of emotions. The model shows how the different emotions can be represented based on valence and arousal.
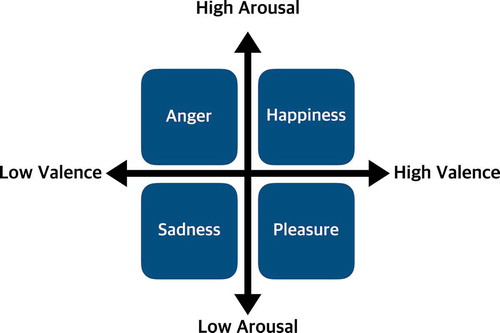
Figure 2. Manual stone casting unit in the LightStone Factory.
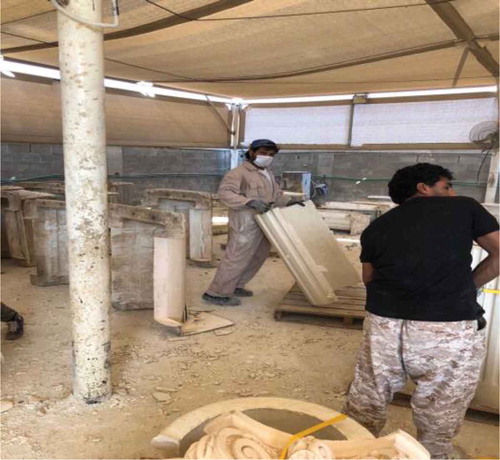
Figure 3. A subject wearing the two sensors.
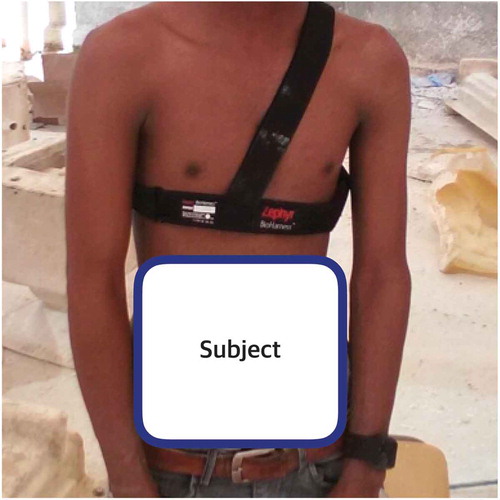
Figure 4. Android mobile application for data collection.
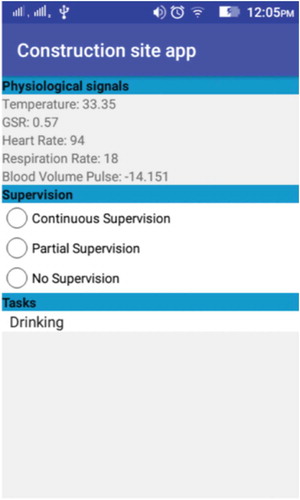
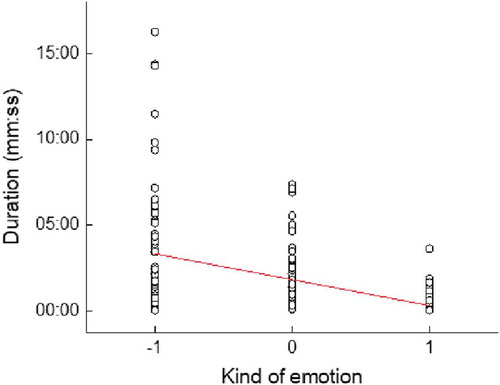
Figure 5. Line fit plot showing the relationship between the worker’s emotional status and task execution duration.