
Figures & data
Table 1. Details of the Korean RC buildings investigated in this study.
Figure 1. Column and wall ratios in the first stories of the buildings investigated.
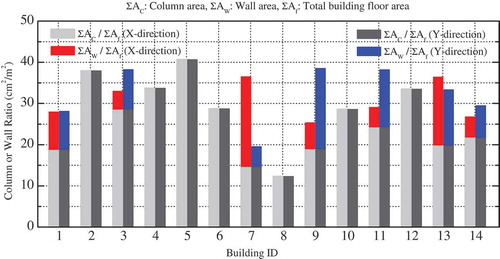
Table 2. Seismic capacity indices (Is) of Japanese buildings (Lee et al. Citation1996a).
Figure 2. Seismic capacity indices (IS) in the X- and Y-directions of 14 existing low-rise RC Korean buildings.
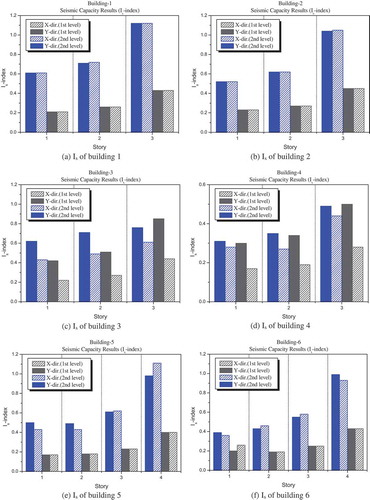
Figure 2. (Continued).
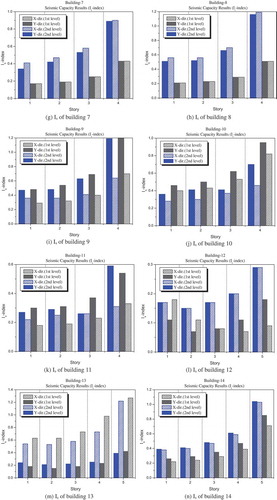
Figure 3. Seismic capacity calculated using the first level procedure of the Japanese Standard in the X- and Y-directions.
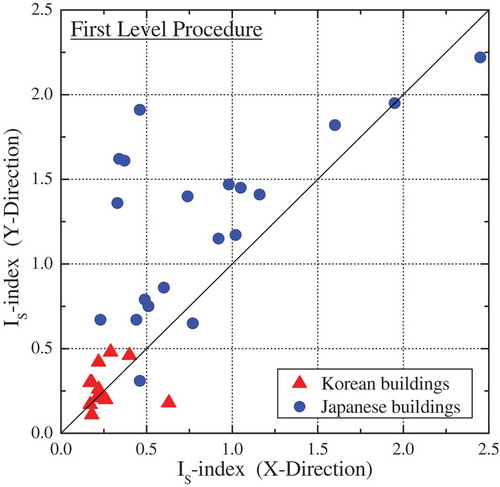
Figure 4. Seismic capacity calculated using the second level procedure of the Japanese Standard in the X- and Y-directions.
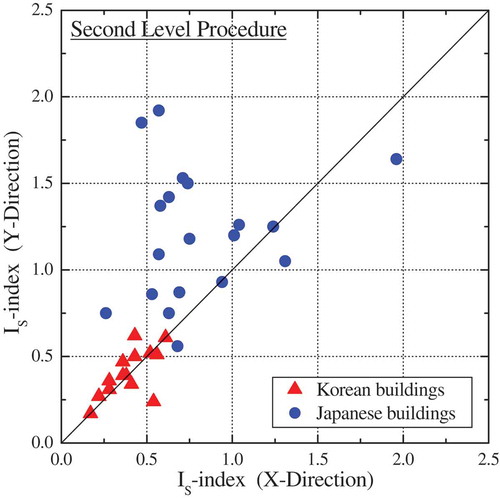
Figure 5. Seismic capacity according to the first and second level procedures.
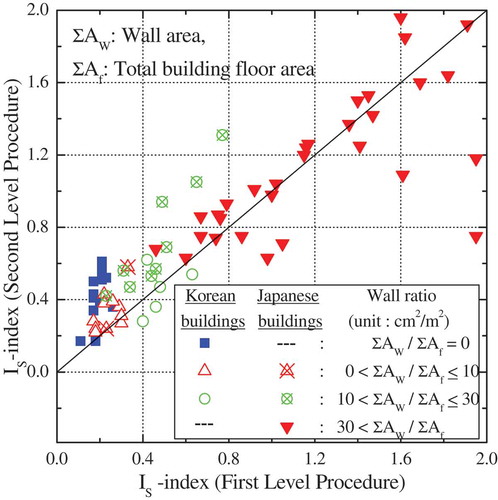
Figure 6. Distribution of seismic capacity indices.
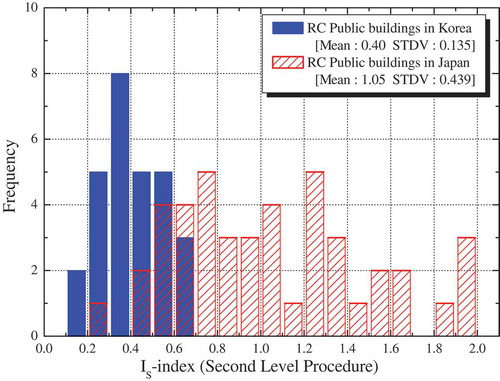
Figure 7. Ductility index distribution of Korean buildings.
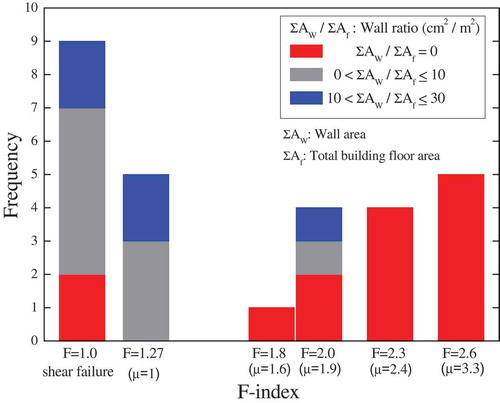
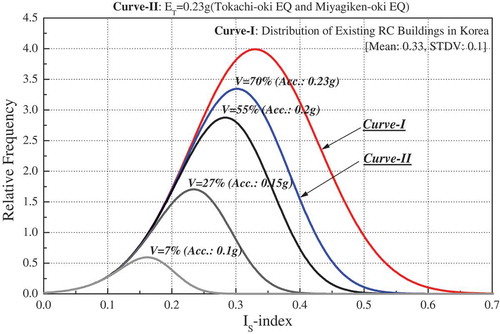
Figure 8. Distribution of seismic capacity indices of RC buildings damaged by past earthquakes.
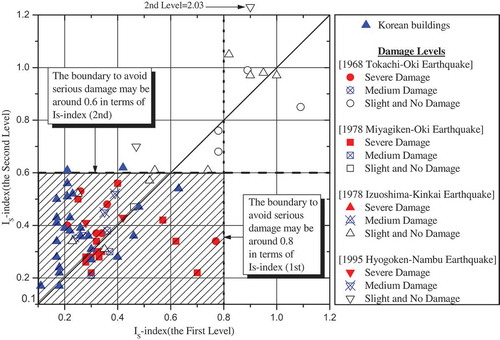
Figure 9. Flowchart of the proposed basic structural index, which is suitable for evaluating Korean RC buildings.
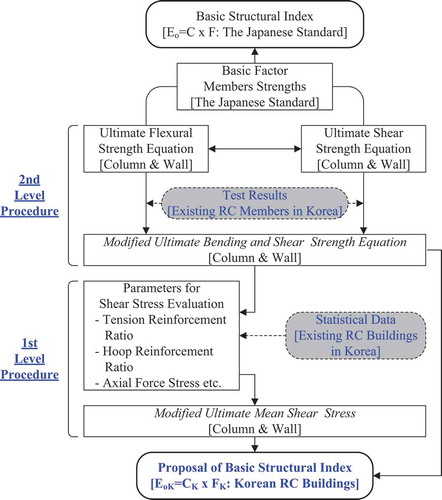
Figure 10. Relationship between cMu values of columns obtained experimentally and computed using Equation (5).
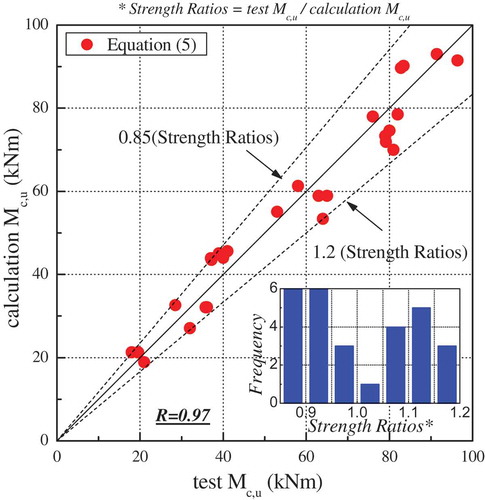
Figure 11. Distribution of shear strength ratios between the experimental and analytical values calculated using Equation (7) for Korean columns.
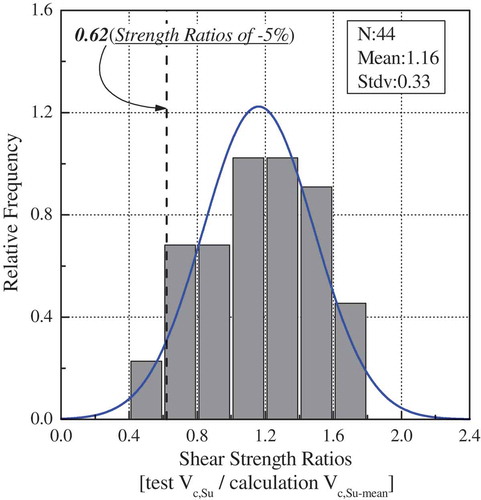
Figure 12. Relationship between Vc,Su values according to the experiments for Korean columns and those calculated using Equations (6) and (8).
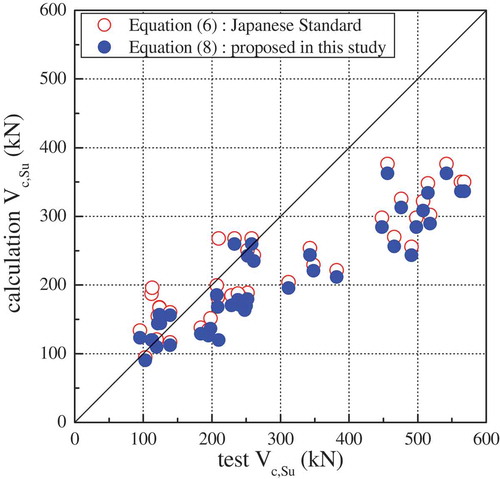
Figure 13. Relationship between experimental values of Mw,u and results calculated using Equation (9).
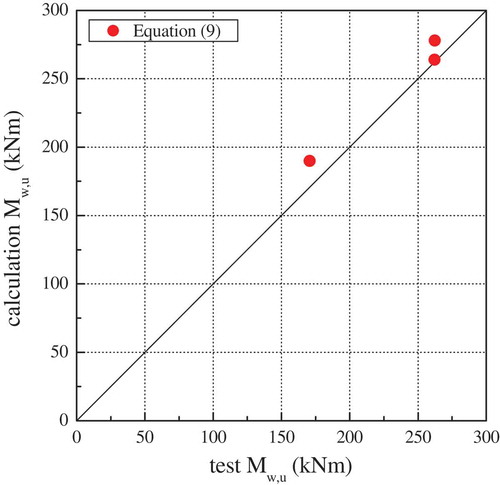
Figure 14. Distribution of the ratios of experimentally measured shear strength to the values calculated using Equation (11).
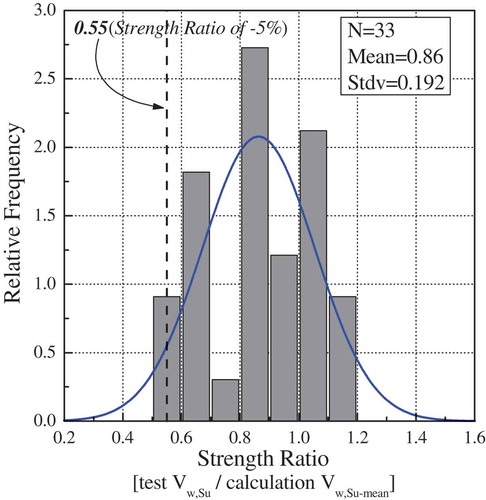
Figure 15. Relationship between the experimental values of Vw,Su and those calculated using Equations (10) and (12).
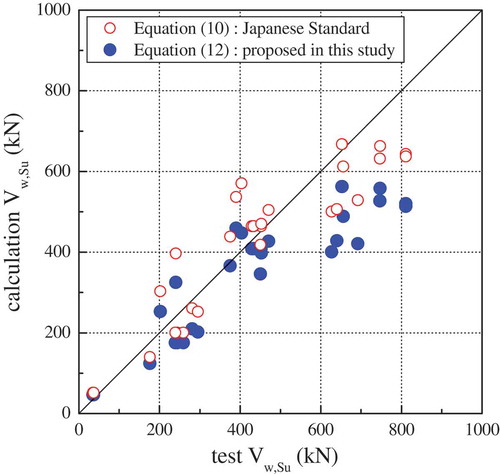
Figure 16. Distribution of tension reinforcement ratios of Korean RC columns.
Figure 17. Distribution of shear reinforcement ratios of Korean RC columns.
Table 3. Parameters used to estimate the unit average shear stress of columns based on the first level procedure.
Figure 18. Unit shear stresses of rectangular columns according to the first level procedure.
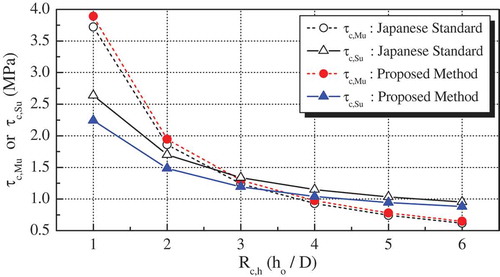
Figure 19. Typical cross section of Korean walls with boundary columns.
Figure 20. Unit shear stresses of walls with boundary columns.
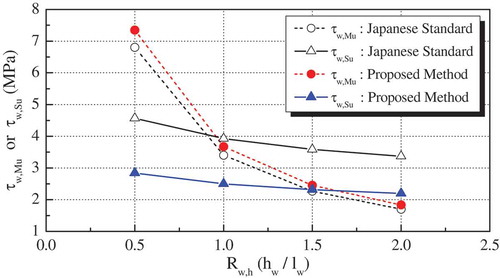
Figure 21. Relationship between Is values (according to the first level procedure) of Korean buildings when calculated using the proposed method and the Japanese Standard.
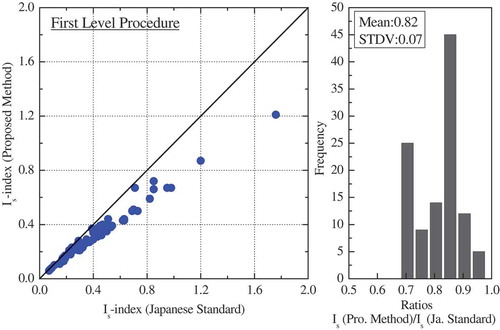
Figure 22. Relationship between Is values (according to the second level procedure) of Korean buildings when calculated using the proposed method and the Japanese Standard.
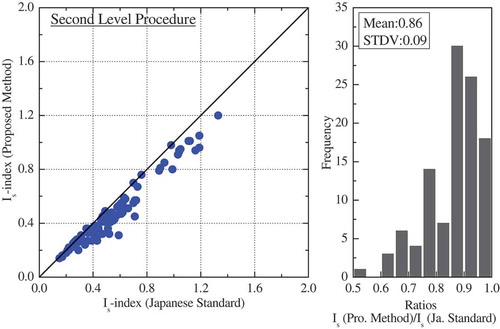
Figure 23. Distribution of Is values of Korean RC buildings evaluated by the proposed method and the Japanese Standard.
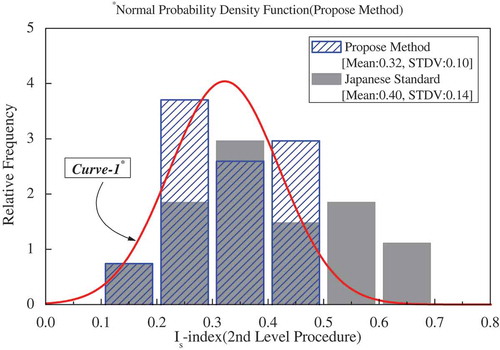
Figure 24. Ductility index distribution of Korean RC buildings computed by the proposed method.
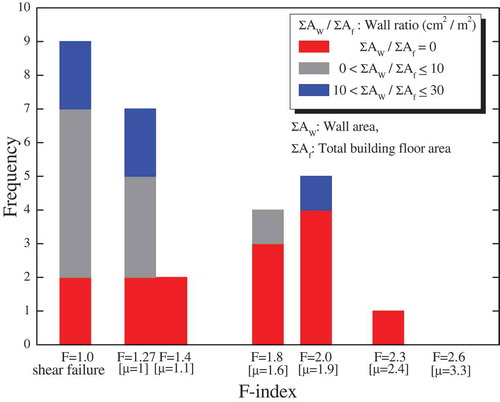
Figure 25. Structural damage ratios of Korean RC buildings due to earthquakes.
Data availability statement
The data described in this article are openly available in the Open Science Framework at DOI:10.17605/OSF.IO/TPA6U.