Figures & data
Figure 1. Location and map of Jiangsu.
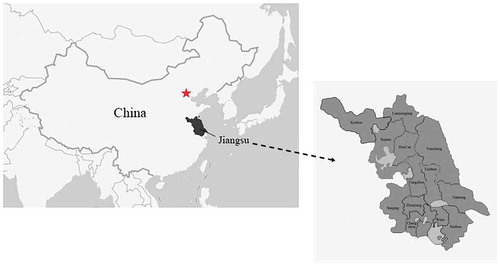
Figure 2. The quantity of detached houses.
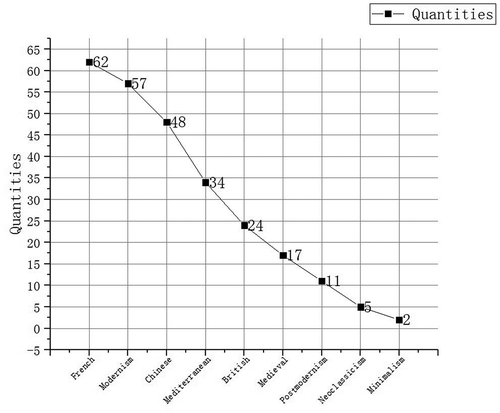
Table 1. The statistics of architectural styles of detached houses in Jiangsu province.
Figure 3. The photos used in the experiment and their numbers.
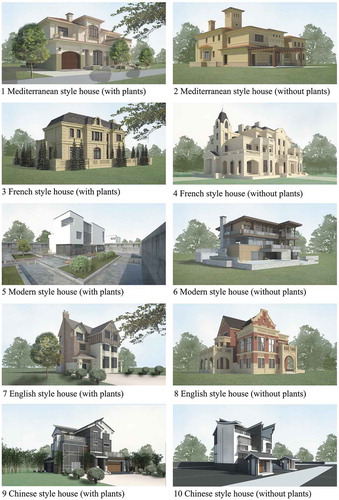
Table 2. The height-width ratio statistics of detached houses.
Figure 4. The schematic diagram of the relative area of windows of detached houses.
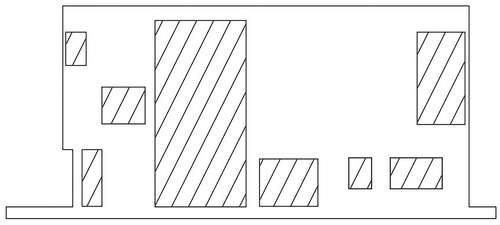
Table 3. The window-wall ratio statistics of detached houses.
Table 4. The variables of demographic characteristics and corresponding set values.
Table 5. The scores and corresponding meaning.
Table 6. The statistics of participants’ demographic characteristics.
Figure 5. The photo with the highest average score.
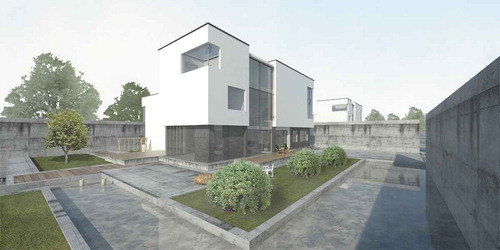
Figure 6. The photo with the lowest average score.
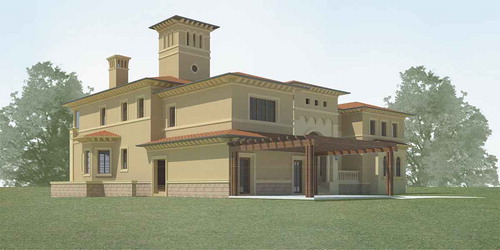
Table 7. Kendall rank correlation analysis.
Table 8. Stepwise multiple linear regression analysis.
Table 9. The linear analysis of photo physical properties for different gender groups.
Table 10. The linear analysis of photo physical properties for different age groups.
Table 11. The linear analysis of photo physical properties for participants having/having no design experience.
Table 12. The linear analysis of photo physical properties for participants of different occupations.
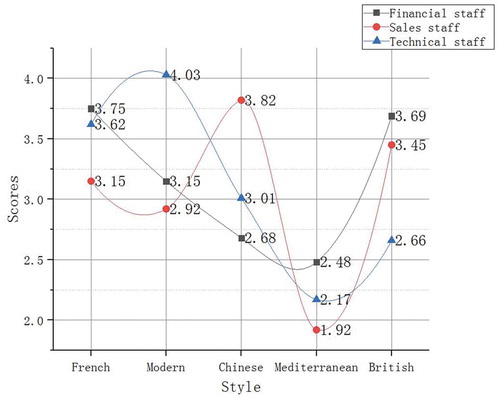
Figure 7. The preference of different gender groups for architectural style of detached houses.
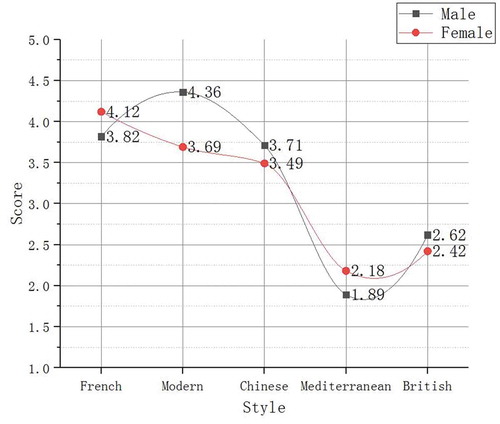
Figure 8. The preference of participants of 36–59 years old for architectural style of detached houses.
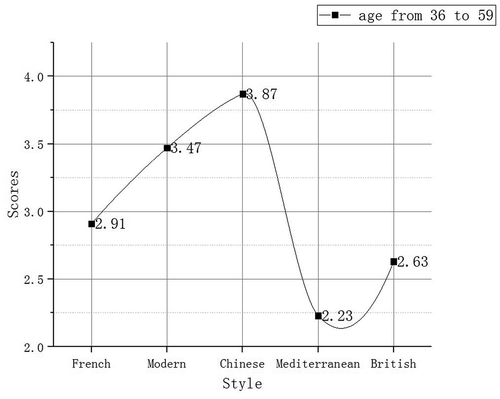
Figure 9. The preference of participants of different occupations for architectural style of detached houses.