Figures & data
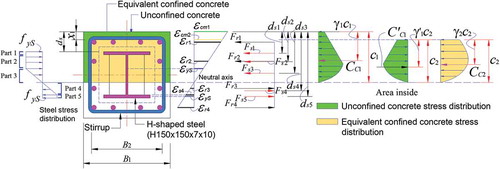
Figure 1. Two simplified zones with concrete stress-strain profiles and axial and lateral forces. (a) Concrete confined by stirrups and a steel section (Parabolic arching formed by the longitudinal bars and structural steel section El-Tawil and Deierlein Citation1999). (b) Strains, stresses, and corresponding force components at the maximum lateral load limit state for the column introduced by (Chen and Lin Citation2006) with 30% axial load column capacity (hoop spacing = 75 mm)
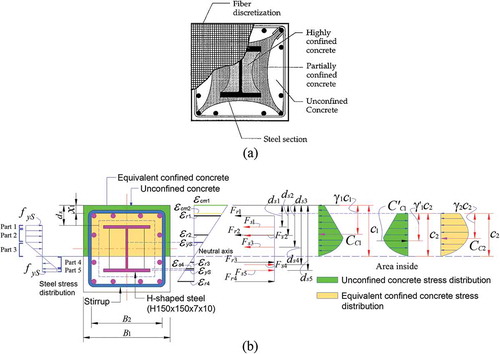
Figure 2. Concrete stresses – strain relationships for zones based on equivalent confining factors (based the confined Mander curves)
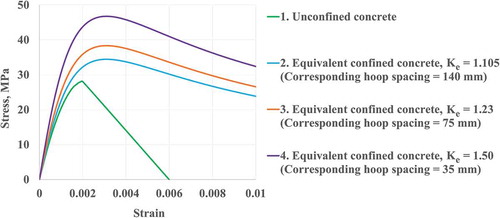
Figure 3. Stress–strain relations in compression and tension (Chen and Lin Citation2006). (a) Longitudinal reinforcing bar in (b) Structural steel in the compression zone (Chen and Lin Citation2006)
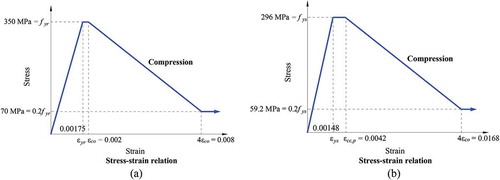
Figure 4. Computation algorithm and analytical equations used to calculate the nominal flexural moment capacity
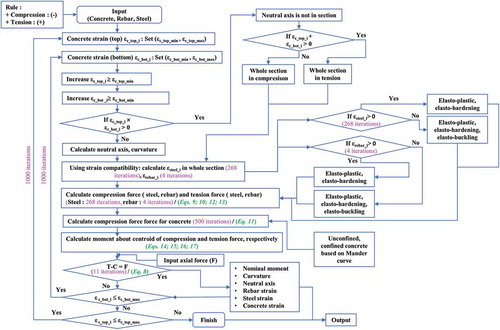
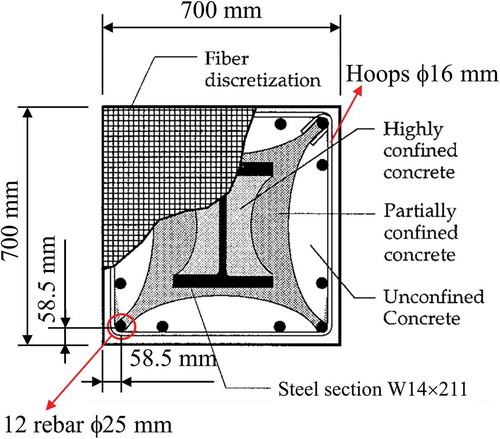
Figure 5. Test specimens of concrete encased steel composite columns with a wide flange steel section (Chen and Lin Citation2006)
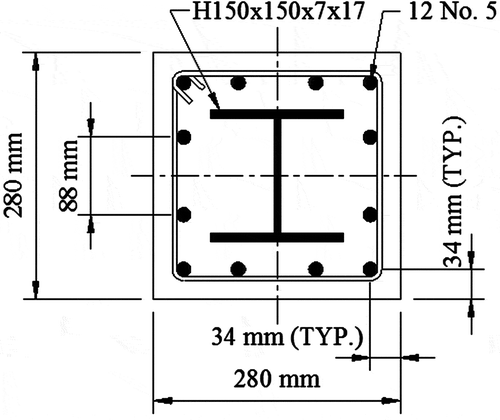
Figure 6. Verification analysis of axial load–strain relationships for concrete with hoop spacings of 140 mm (29.5 MPa, SRC1), 75 mm (28.1 MPa, SRC2), and 35 mm (29.8 MPa, SRC3) and equivalent confining factors; columns tested by Chen and Lin (Citation2006) ()
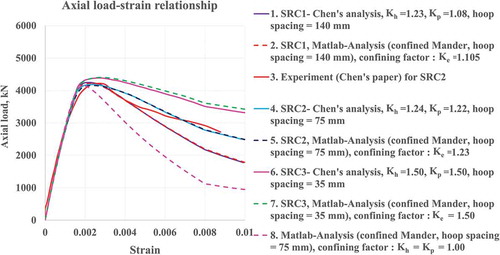
Figure 7. Composite columns S-08 (El-Tawil and Deierlein Citation1999). (a) Details of Seismic Hoop Reinforcement for S-08. (Hoop spacing @ 100 mm (highly confined) for concrete with f’c = 28 and 69 MPa, and @ 75 mm for 110 MPa). (b) Prototype composite columns S-08 (Hoop spacing @ 320 mm (lightly confined) for non-seismic standard)
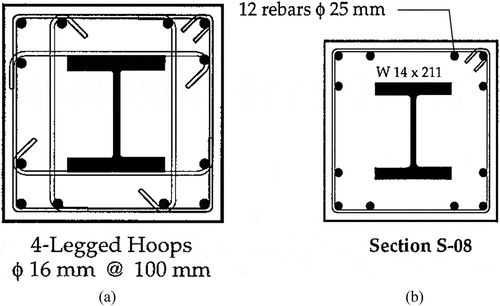
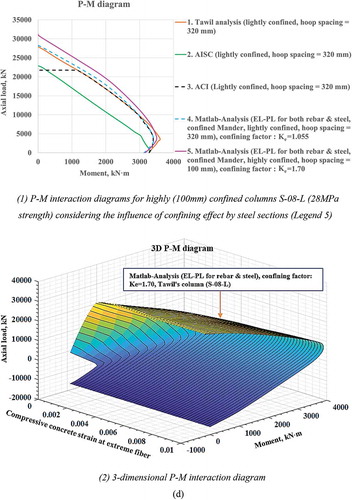
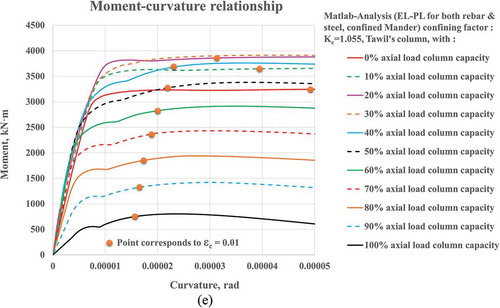
Figure 8. Failure criterion of the column described in based on the confined concrete by both rebars and encased steel section; columns tested by El-Tawil and Deierlein (Citation1999). (a) Verification analysis column S-08-L with axial and lateral load combinations; highly (100 mm) and lightly (320 mm) confined columns with strength = 28 MPa. (b) Verification analysis column S-08-M with axial and lateral load combinations; highly (100 mm) and lightly (320 mm) confined columns with strength = 69 MPa. (c) Highly (75 mm) and lightly (320 mm) columns S-08-H of 110 MPa strength. (d) P-M diagram for highly confined columns (100 mm) of 28 MPa. (e) Influence of axial load ratio (Pu/Pn) on the moment–curvature relationships for highly (100 mm) confined composite columns with low concrete strength (28 MPa). (f) Influence of the confining effects vs. concrete strength
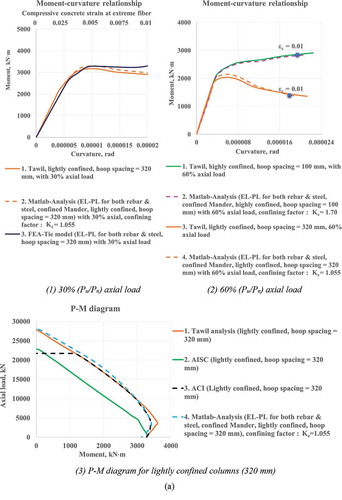
(Continued)
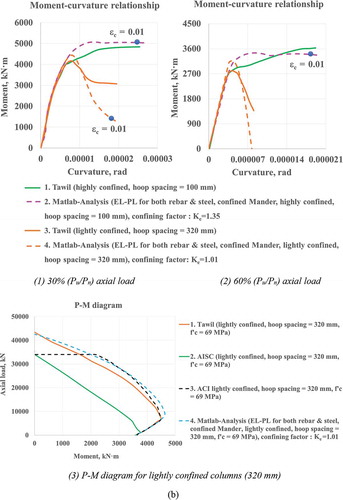
(Continued)
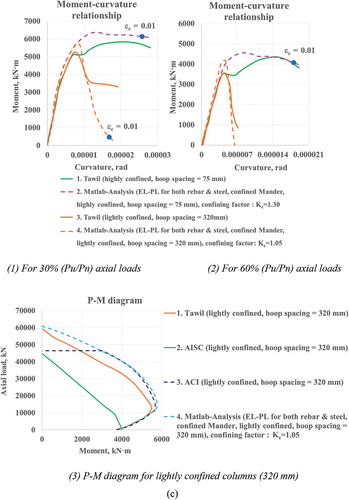
(Continued)
(Continued)
(Continued)
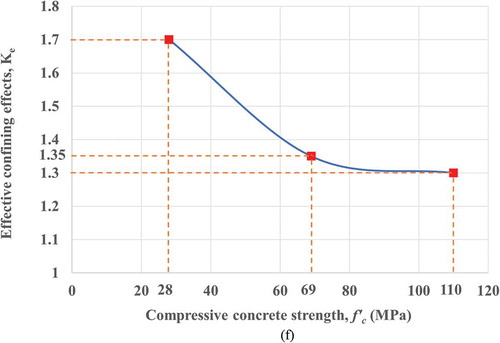
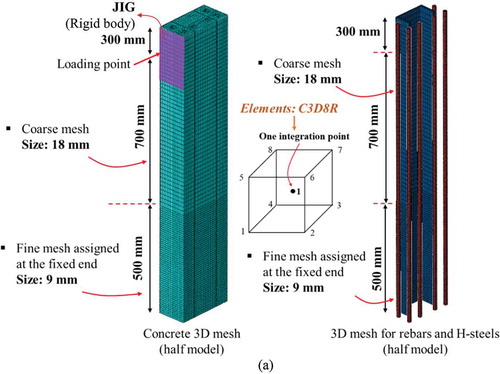
Figure 9. Three-dimensional FE model developed for use with the composite column: elements and discretization. (a) FEA meshes. (b) Application of axial loads on symmetric model. (c) Constitutive relations with concrete damaged plasticity (CDP); scalar damage variables (Hong Citation2019)
(Continued)
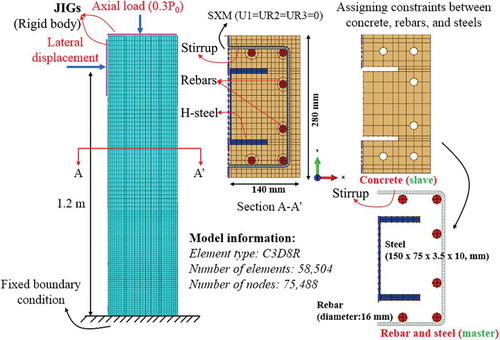
(Continued)
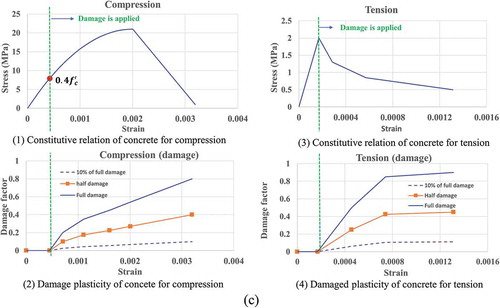
Figure 10. Modeling of reinforcing bars and steels in steel–concrete composite members; tie modeling technique (Nzabonimpa Citation2018)
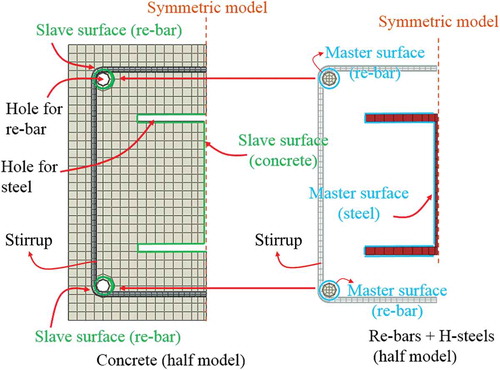
Table 1. Geometric properties of the composite columns
Table 2. Material properties
Figure 11. P-M diagrams for strain evolutions (equivalent confining factors) with a hoop spacing of 75 mm, EL-PL for rebar & steel except EL-buckling for rebar in compression columns with compressive strength of 28.1 MPa tested by (Chen and Lin Citation2006) (, SRC2). (a) P-M diagrams for concrete with a hoop spacing of 75 mm and concrete strains between 0.001 and 0.01. (b) Concrete strain of 0.001. (c) Concrete strain of 0.002. (d) Concrete strain of 0.003. (e) Concrete strain of 0.005. (f) Concrete strain of 0.007. (g) Concrete strain of 0.01
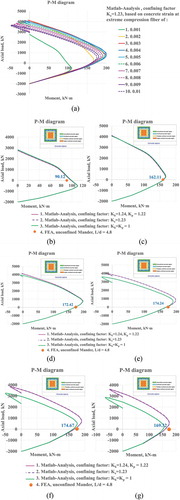
Table 3. Flexural capacities of the columns tested by Chen and Lin (Citation2006) at the maximum and design load and design load limit states (εc = 0.003) with 30% axial load column capacity, Ke;1.105 (140 mm, 29.5 MPa); 1.23 (75 mm, 28.1 MPa); and 1.5 (35 mm, 29.8 MPa)
Figure 12. Three-dimensional fracture surfaces; columns with compressive strength of 28.1 MPa tested by Chen and Lin (Citation2006) (, SRC2). (a) Three-dimensional P-M diagrams (b) Moment-concrete strain (axial) relationships
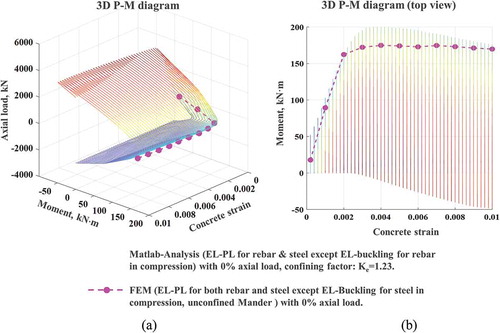
Figure 13. Moment–curvature relationships for results that either account for or ignore the confining effects from steel sections encased in columns with compressive strength of 28.1 MPa tested by Chen and Lin (Citation2006) (, SRC2). (a) Influence of confining effect by steel section with buckling of rebars (EL-PL for both rebar & steel except EL-buckling for rebar in compression) (moment vs. concrete curvature). (b) Influence of rebar buckling with confining effect by steel section (hoop spacing 75 mm). (c) Curvature vs. compressive concrete strains identifying the influence of confining effect by steel sections (EL-PL for both rebar & steel except EL-buckling for rebar in compression)
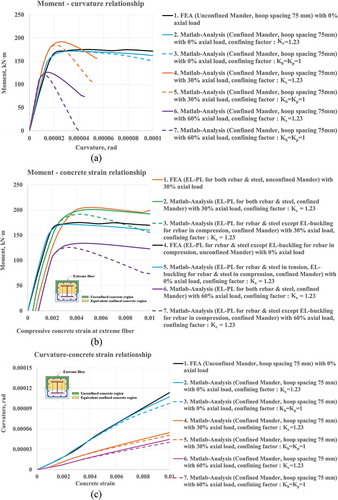
Figure 14. Idealized equivalent confining factors for the double confinements without lateral loads; columns with a compressive strength of 28.1 MPa tested by Chen and Lin (Citation2006) (, SRC2). (a) Equivalent confining factors at varying concrete strains. (b) Equivalent confining factors with varying hoop spacing
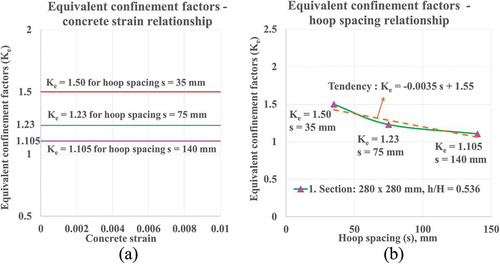
Figure A1. Geometric configuration of the steel column encased in the structural concrete