Figures & data
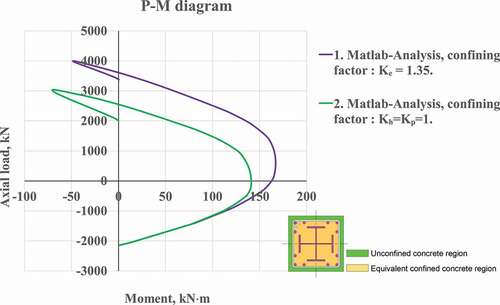
Table 1. Geometric properties of the SRC columns and tested material properties
Figure 1. Increased concrete strength at the maximum load limit state (cross-shaped steel cores). (a) Strains, stresses, and corresponding force components for the column with 40% of axial load column capacity tested by (Chen and Lin Citation2006) at the maximum limit state; confinement was provided by cross-shaped steel cores with a hoop spacing of 75 mm. (b) Confined stress–strain relationships for the concrete represented by the equivalent confining factors (based on the confined Mander approach)
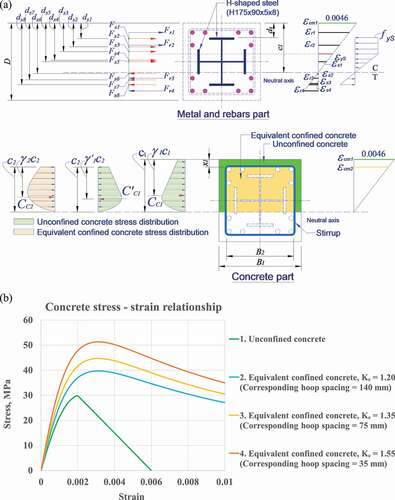
Figure 2. Flowchart used to calculate nominal flexural moment capacity. (a) Process of finding nominal moment of the steel-concrete section. (b) Computing algorithm and analytical equations used to calculate nominal flexural moment capacity (Nguyen and Hong Citation2020)
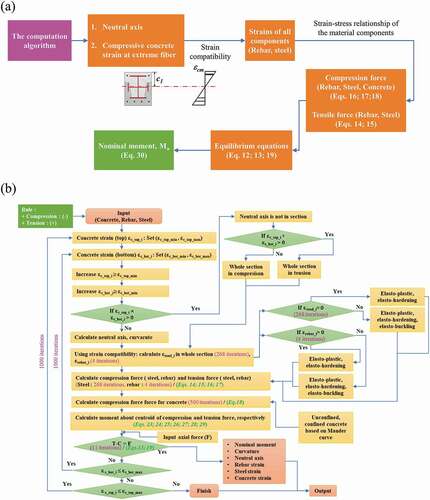
Figure 3. Composite concrete column encasing steel sections with cross- shape (Chen and Lin Citation2006)
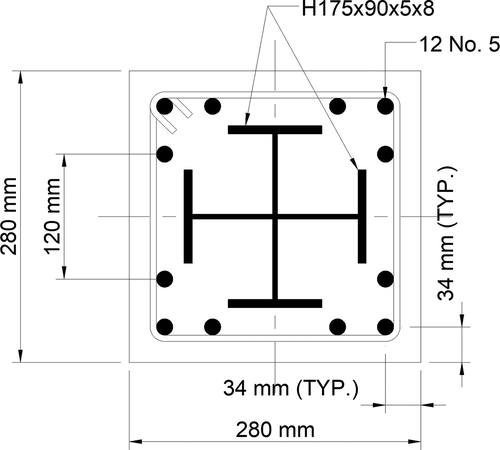
Figure 4. Verification analysis with cross-shaped steels; axial load-strain relationships for concrete with a hoop spacing of 140 mm (SRC4, 29.8 MPa), 75 mm (SRC5, 29.8 MPa), and 35 mm (SRC6, 29.5 MPa) (Chen and Lin Citation2006)
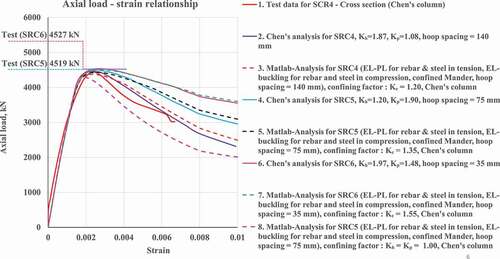
Figure 5. P-M diagrams for the strain evolutions (equivalent confining factors) with a hoop spacing of 75 mm, EL-PL for the rebar and steel (except EL-buckling for rebar in compression); the columns with a compressive strength of 29.8 MPa were tested by (Chen and Lin Citation2006) (SRC5). (a) P-M diagrams for the concrete with a hoop spacing of 75 mm for the concrete strains between 0.001 and 0.01. (b) Concrete strain of 0.003. (c) Concrete strain of 0.01
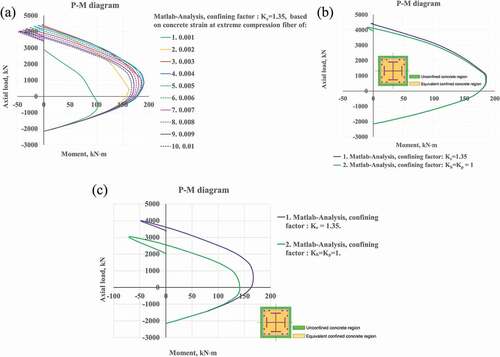
Table 2. Flexural capacities of the columns tested by (Chen and Lin Citation2006) at the maximum and design load limit states (εc = 0.003) with a 60% axial load column capacity, Ke; 1.20 (140 mm, 29.8 MPa); 1.35 (75 mm, 29.8 MPa), and 1.55 (35 mm, 29.5 MPa)
Figure 6. P-M diagrams for the strain evolution (equivalent confining factors) with a hoop spacing of 75 mm (SRC5), EL-PL for both rebar and steel; columns with a compressive strength of 29.8 MPa, Chen and Lin’s column (SRC5) (Chen and Lin Citation2006). (a) P-M diagrams for concrete with a hoop spacing of 75 mm for the concrete strain between 0.001 and 0.01. (b) Concrete strain of 0.003. (c) Concrete strain of 0.01
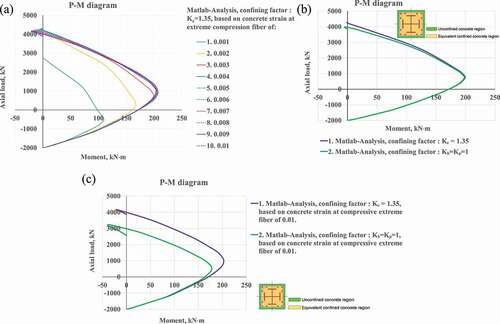
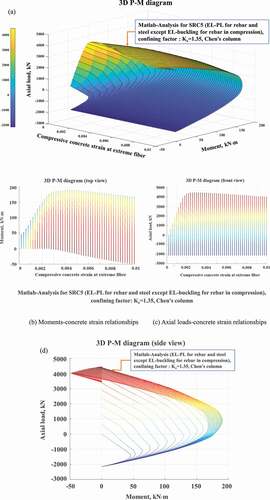
Figure 7. Three-dimensional fracture surface of SRC5 (rebars with elasto-bucking). (a) Three-dimensional P-M diagrams (surface view). (d) Three-dimensional P-M diagrams (axial load vs. moment)