Figures & data
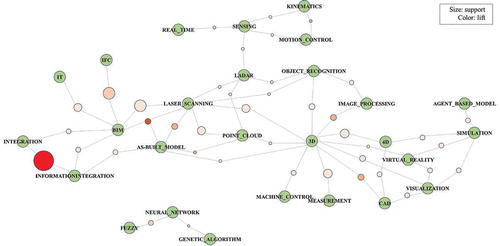
Figure 1. Keyword co-occurrence matrix using the cosine coefficient
Table 1. Basic statistics on the whole keyword network
Figure 2. Cumulative degree distribution of the keyword network
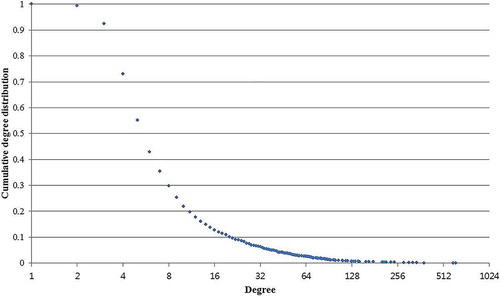
Figure 3. Correlation between the keyword frequency and centrality indicators: (a) Correlation between frequency and degree centrality, (b) Correlation between frequency and betweenness centrality, and (c) Correlation between degree and betweenness centrality
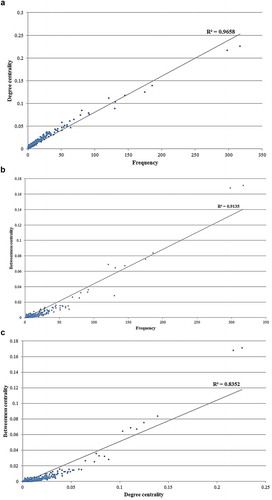
Table 2. Important keywords in the field of construction automation and robotics
Table 3. Important keywords from 2014 to 2016
Table 4. Comparison of important keywords by region
Table 5. Classification of CEM categories and their representative keywords
Figure 4. Changes in CEM research based on A&RT over time
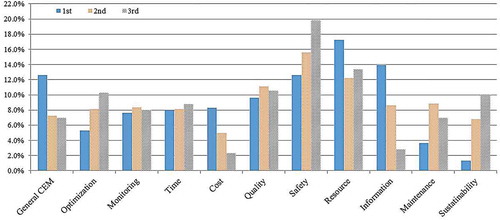
Figure 5. Changes in the proportion of technology-related keywords over time: (a) Group I, (b) Group II, and (c) Group III
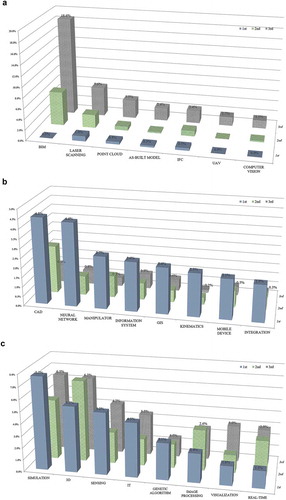
Figure 6. Association rules between CEM areas and technology-related keywords
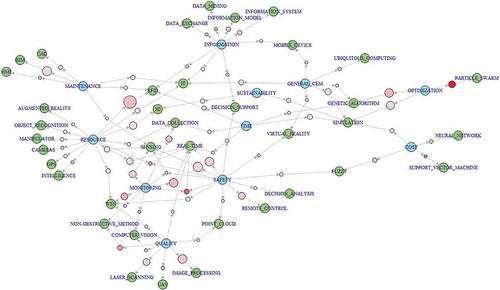
Figure 7. Major association rules between technology-related keywords