
Figures & data
Figure 1. Axonometric of the designed model, showing roof structure and spaces
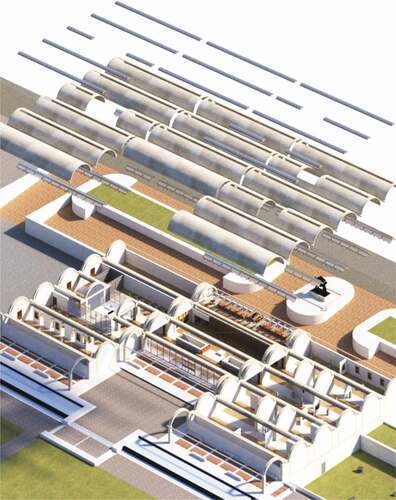
Figure 2. Floor plan of the virtual model showing main areas as follows; 1) Lobby 2) Library 3) Café 4) North gallery 5) South gallery A 6) South gallery B
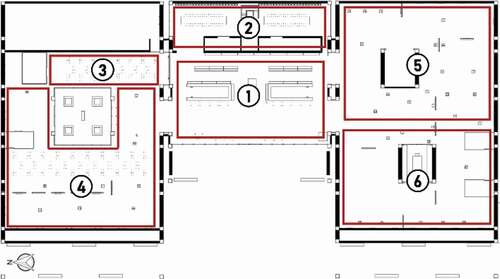
Figure 3. Daylighting strategy in Kimbell museum through light reflector devices (CitationLouis I. Kahn Building | Kimbell Art Museum)
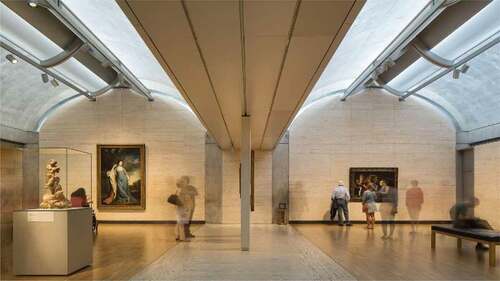
Figure 4. A diagram showing the experiment workflow and outputs
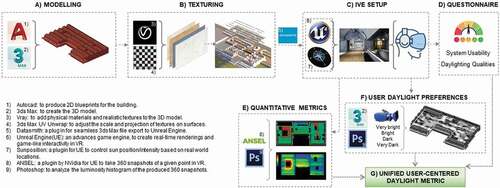
Figure 5. Daylighting conditions in different areas of the virtual museum at the two designated day times
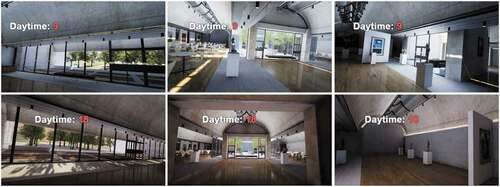
Figure 6. Luminance distribution of an identical scene in Daylight Visualizer (left) and UE4 (right) at 9 am
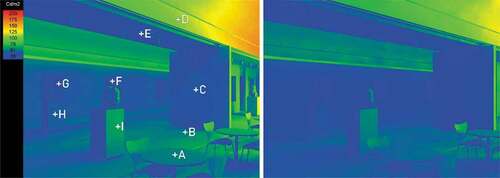
Table 1. Illuminance results in Velux Daylight Visualizer and UE4, showing error percentage of each measurement
Figure 7. A participant trying the sample scene at different daytimes
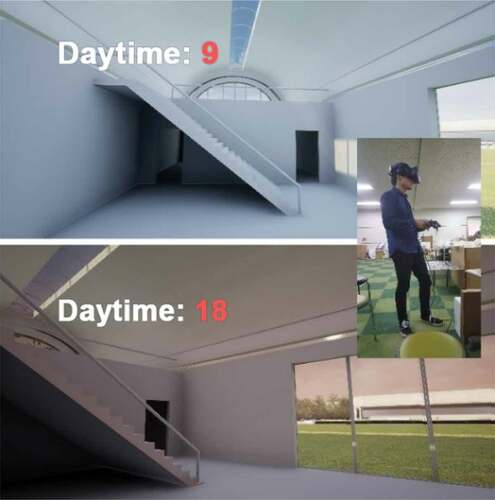
Figure 8. A participant taking a snapshot for a bright scene
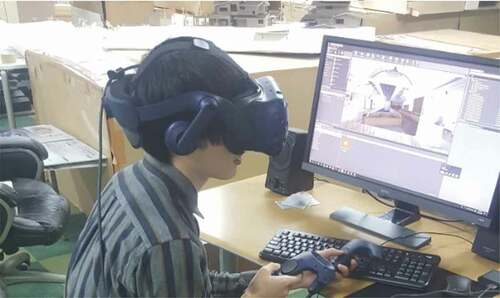
Table 2. The post-experience questionnaire aspects and questions
Figure 9. PLM (upper) and Illuminance map (lower) for the virtual model on June 23, 9 am
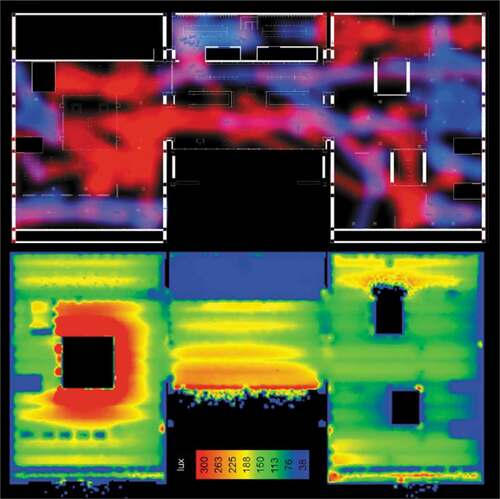
Figure 10. Workflow of developing mean and SD brightness maps for the virtual model
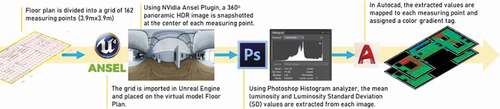
Figure 11. Participants’ ratings for system realism and simulated daylighting
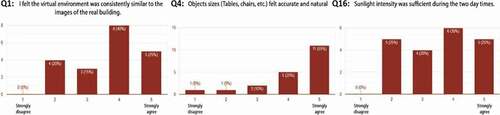
Figure 12. Participants’ snapshots distribution at 9 am and 6 pm
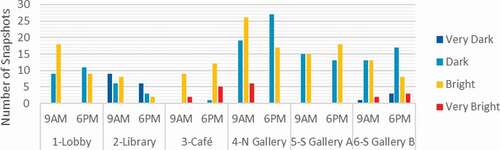
Figure 13. Sample of scenes perceived by participants as “very bright” (upper row) and “very dark” (lower row) at the two day time settings
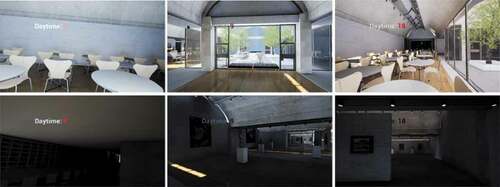
Figure 14. Heat maps showing the density of users’ evaluated snapshots (T is daytime)
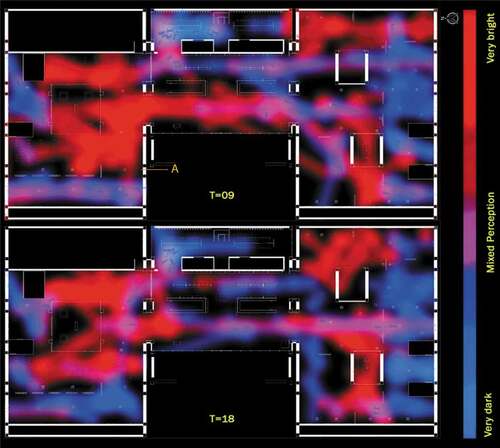
Figure 15. Average scene brightness values (upper) and SD values (lower) of the virtual model at 9 am
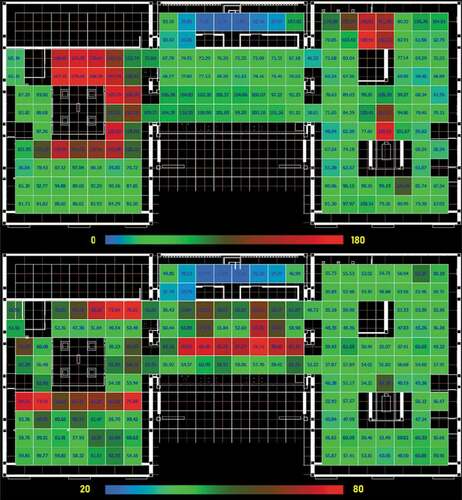
Figure 16. Scatter plot of perception-based ranking and mean brightness values for a given spot at 9 am
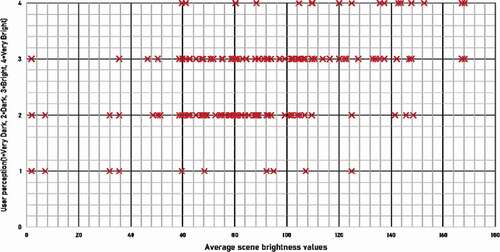
Table 3. Pearson correlation analysis between scene brightness values and user snapshot rankings
Figure 17. Scenes where “mixed perception” occurs and their respective snapshots at 9 am
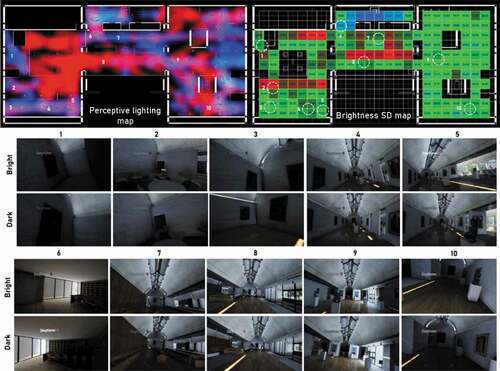
Table 4. Areas of “mixed perception” and their respective SD and mean brightness values