
Figures & data
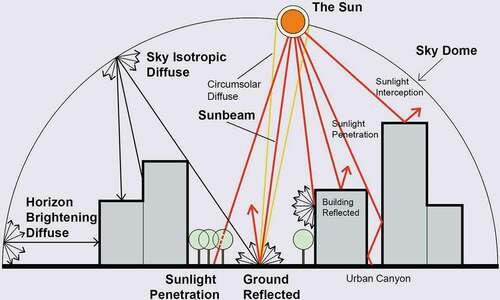
Figure 1. The map of daylight climate zones (DCZ) and the location of Shenzhen (source: MOHURD Citation2012; translated and redrawn by authors).
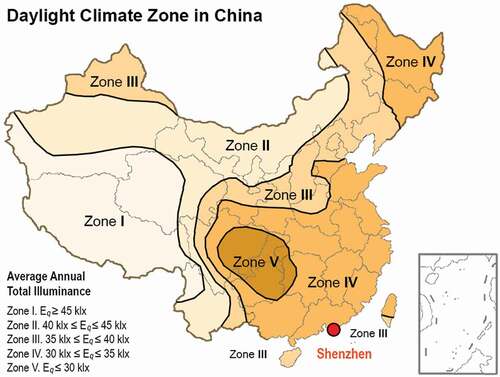
Figure 2. A map of Shenzhen’s annual total solar radiation (source: Shenzhen Climate Centre Citation2011; translated by authors).
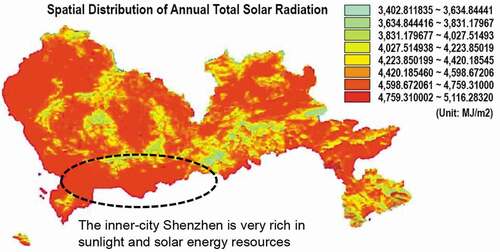
Table 1. Descriptions of examined urban design factors (UDFs) in this research (source: reviewed and summarised by authors)
Figure 3. Locations (up: the red dots) and satellite aerial views (down: yellow circles) of the 11 tested sites in the inner-city Shenzhen (source: up image: Shenzhen Municipal Planning and Natural Research Bureau, Shenzhen Master Plan 2010-2020, reproduced and re-interpreted by authors; down image: Baidu Satellite Map in 2017, and drawn by authors).
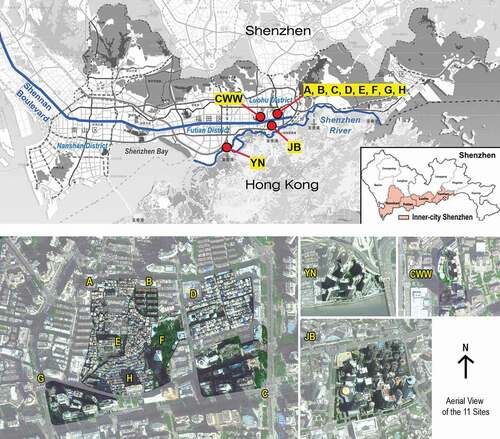
Figure 4. Morphological patterns, monitoring points, and representative sky view images of the 11 sites located in inner-city Shenzhen (source: drawn and photographed by authors).
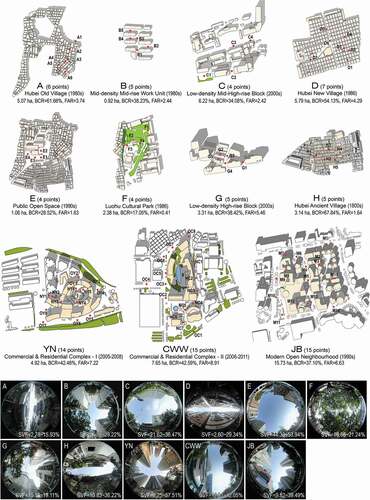
Figure 5. Comparison of the 11 sample sites’ morphological characteristics. Urban density factors: (a) (b) (c); Urban geometry factors: (d) (e) (f) (g); Site factors: (h) (i) (j); Greenery factor: (k); Ground surface material factor: (l) (surveyed and drawn by authors). Notes: 1) Here, TCR means the tree coverage ratios at the ground level, while the trees planted on the roofs were not taken into account for the investigation of performances of daylight and solar radiation at the pedestrian level in this research. 2) Each site’s GSA was weighted average value and calculated based on the ratios of different land cover types (except for the buildings) and ground surface materials within the site, not the average value of the tested spaces in each site.
Table 2. Plot size, morphological characteristics, and building information of the selected 11 sites (surveyed by authors)
Table 3. Data collection instruments and analytical tools in this research (made by authors)
Figure 6. Processes of monitoring the outdoor daylight parameters on site (source: photographed by authors).
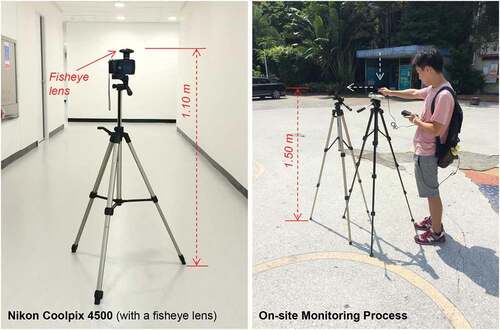
Figure 7. Hourly changes of daytime average horizontal illuminance level of the 11 sites.7
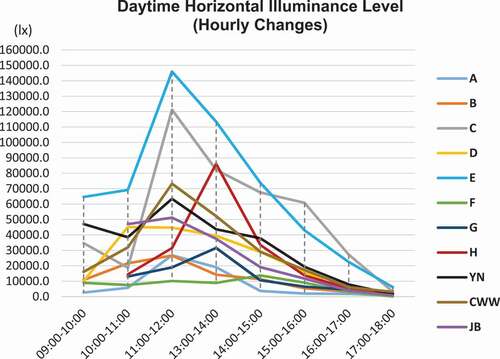
Figure 8. Peak hours horizontal illuminance level (11:00 am-16:00 pm average) and daytime average illuminance level (D-HIL) of the 11 sites.
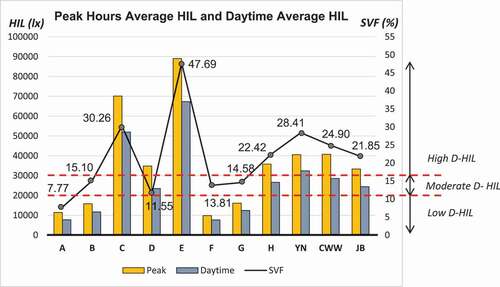
Figure 9. Boxplot of daytime horizontal illuminance level of all tested points in the 11 sites.
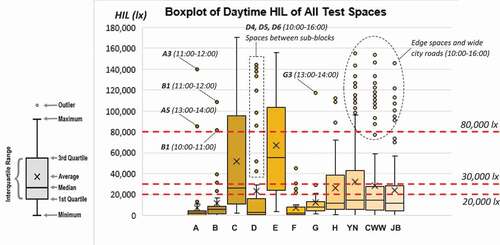
Figure 10. Hourly changes of site illuminance uniformity (SUo) of the 11 sites during the daytime (the minimum requirement of Uo in Japan is 0.20).
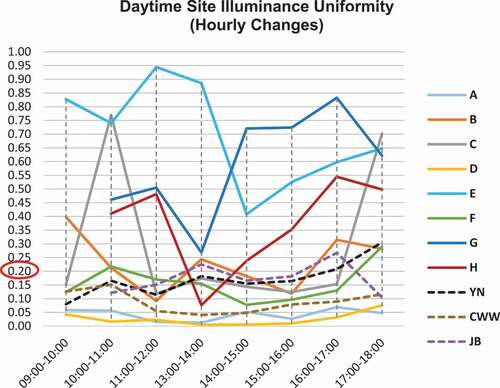
Table 4. Pearson’s correlation between UDFs and examined environmental parameters
Table 5. Pearson correlation test among the 12 UDFs (except for the canyon axis orientation CAO)
Figure 11. Scatter plots for Site-level UDFs and Point-level UDFs against the daytime average horizontal illuminance level (D-HIL) and the daytime site illuminance uniformity (D-SUo): a) between BCR and site avg. D-HIL, (b) between MNN and site avg. D-HIL, (c) between BCR and D-SUo; (d) between FAR and D-Suo, (e) between SVF and D-HIL; (f) between TSF and D-HIL; (g) between H/W and D-HIL, and (h) between GSA and D-HIL.
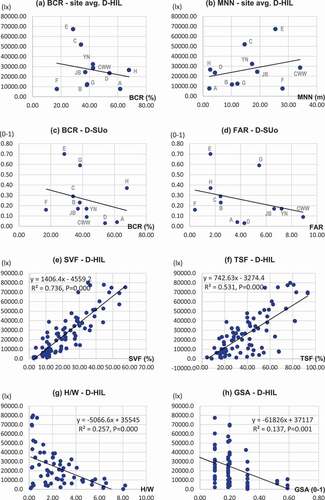
Table 6. Summary of the multivariable linear regression models of the examined environmental parameters
Table 6a. Regression analysis for average D-HIL of the 11 tested sites
Table 6b. Regression analysis for average M-HIL of the 11 tested sites
Table 6c. Regression analysis for average EA-HIL of the 11 tested sites
Table 6d. Regression analysis for average LA-HIL of the 11 tested sites
Table 6e. Regression analysis for D-SUo of the 11 tested sites
Figure 12. Different types of light reflection changed by the ground surfaces (source: Miguet and Groleau Citation2002, redrawn by authors).
Figure 13. Example of effects of sunlight interception and penetration during the daytime: (a) Site YN-Space NY5; (b) Site JB-Space M12; (c) Site A-Space A2; (d) Site A-Space A3; (e) Site D-Space D1, D2 and D3; (f) Site F-Space F2 (source: photographed by authors).
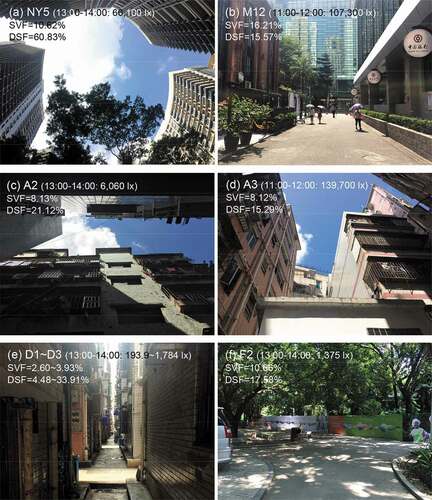
Figure 14. Mechanisms of outdoor illumination in cities: daylight and solar radiation patterns within urban canyons (source: drawn by authors, based on field observation and literature review of Miguet and Groleau Citation2002; Kotzen Citation2003; Tregenza and Wilson Citation2011; Douglas and James Citation2015; Giridharan Citation2016).
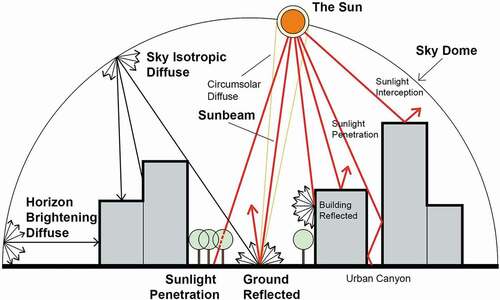
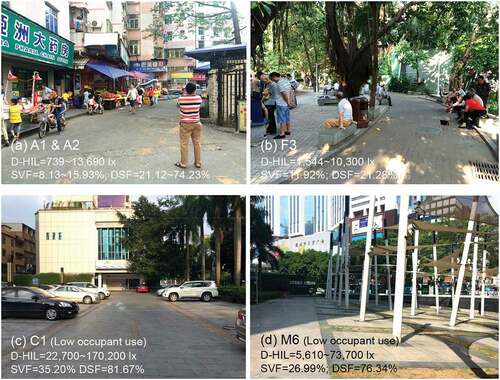
Figure 15. Examples of daytime occupant use of outdoor spaces in different types of urban (sub)neighbourhoods: (a) Site A – A1 and A2 (urban village); (b) Site F – F3 (urban park); (c) Site C – C1 (modern urban block); and (d) Site JB – M6 (urban open space) (source: photographed by authors).
Table