
Figures & data

Figure 1. Behavior of the concrete in tension and compression.
Figure 2. Bilinear stress–strain diagram for both prestressing and non-prestressing steel.
Figure 3. Stress–strain distribution of the cross-section before and after cracking.
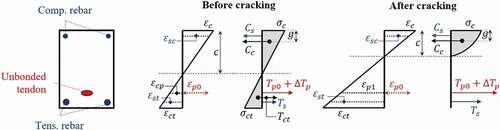
Figure 4. Trial-and-error procedure for the section analysis.
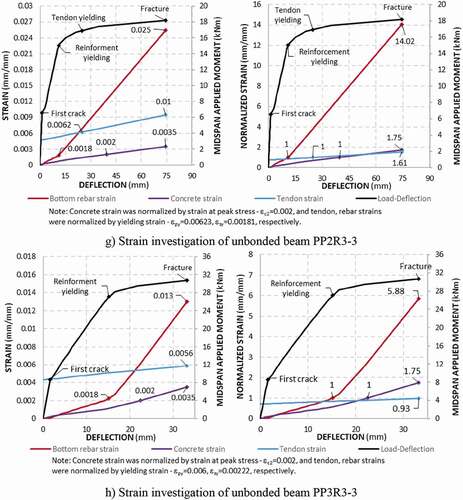
Figure 5. Comparison of the experimental mid-span deflection to the analytical model.
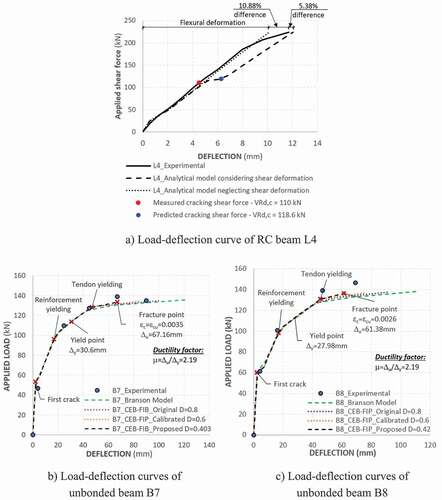
Figure 5. Continued
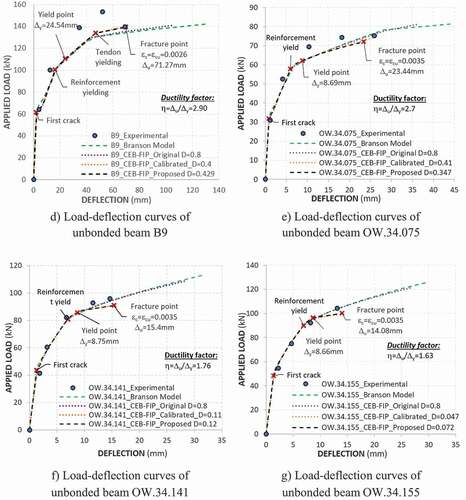
Figure 5. Continued.
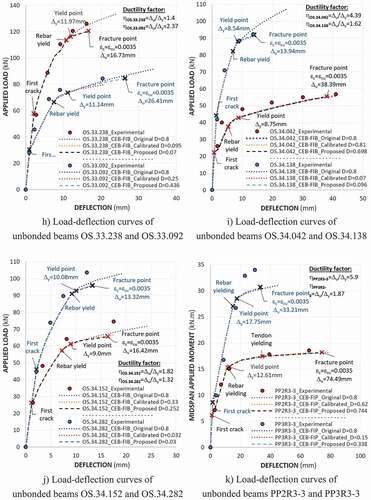
Figure 5. Continued.
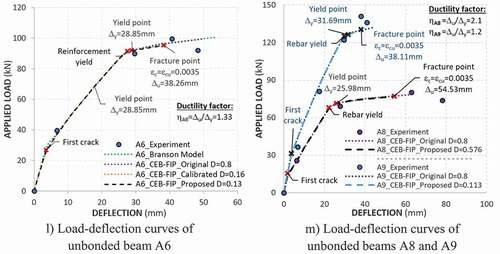
Figure 6. Typical element strain distribution between adjacent cracks (CEB–FIB Model Code Citation1990).
Figure 7. Relationship between coefficient of determination – and contribution factors –
,
.
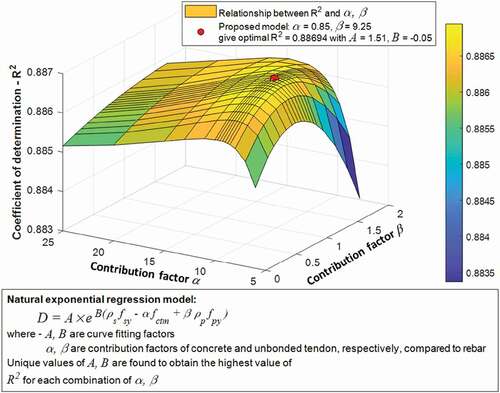
Figure 8. Proposed tension stiffening factor at post-yielding region for unbonded post-tensioned beam.
Figure 9. Procedure for the shear deformation computation.
Figure 10. Deflection computation procedure in all loading stages.
Table 1. Decription of the beam specimens
Figure 11. Typical beam specimen dimensions.
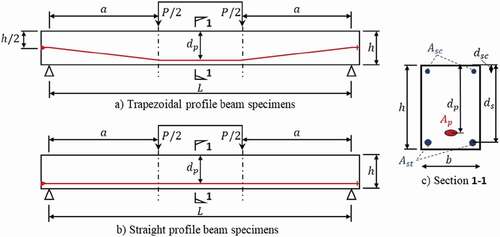
Table 2. Comparison of load capacity and deflection at maximum load between test result and analytical model
Table 3. Drucker–Prager coefficients for concrete damage plasticity model
Table 4. Interaction setup between each element in numerical model
Figure 12. Strain observation in the numerical model.
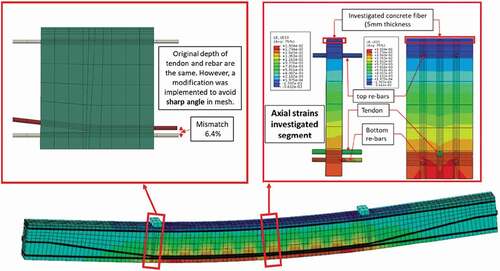
Table 5. Strain comparisons between simple parabola–rectangle concrete model and modified Kent & Park concrete model
Figure 13. Strain comparison of unbonded beam B7 between proposed analytical model and numerical model.
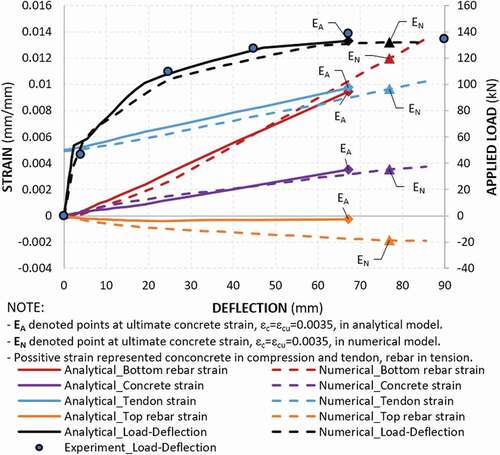
Figure 14. Strain comparison of unbonded beam B8 between proposed analytical model and numerical model.
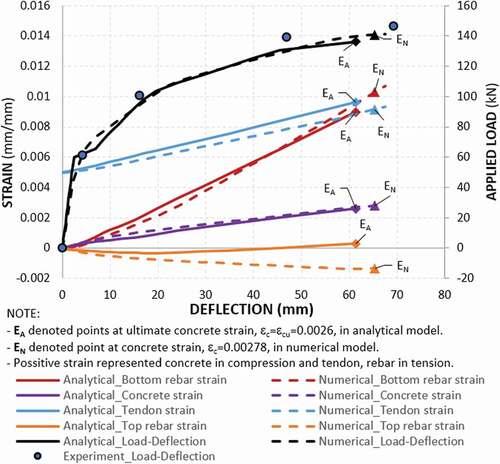
Figure 15. Continued.
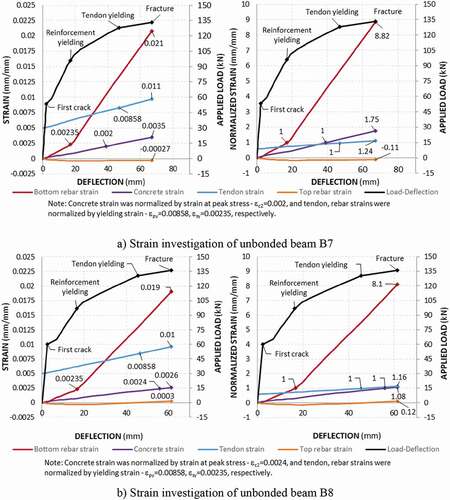
Figure 15. Continued.
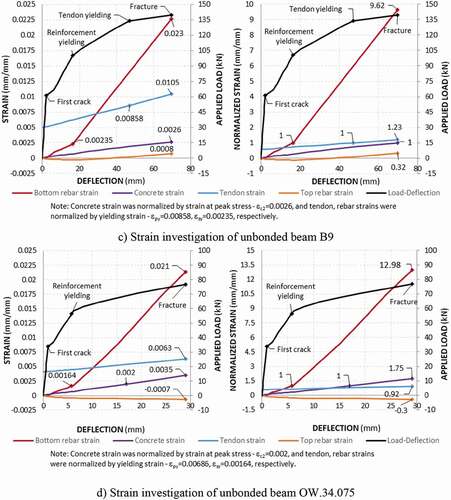
Figure 15. Continued.
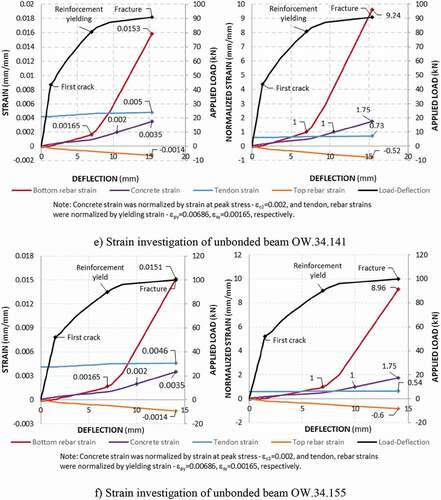
Figure 15. Continued.
Table