Figures & data

Figure 1. Japanese cob structure, 200 years old.
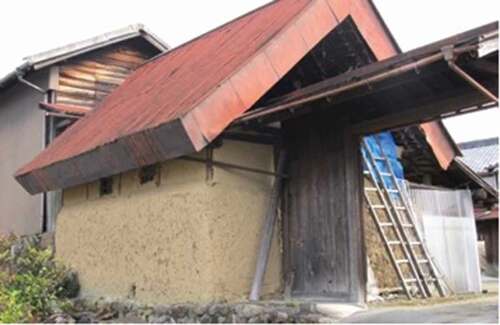
Figure 2. Built with cob balls.
Figure 3. Built with cob piles.
Figure 4. Built with cob wet adobe bricks.
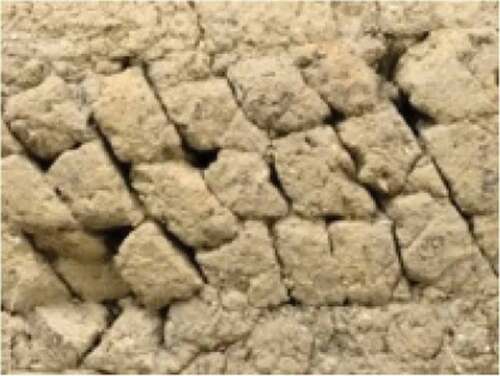
Figure 5. A 2017 sakan surface restoration of 100-year-old Kyoto temple perimeter wall reveals cob ball core.
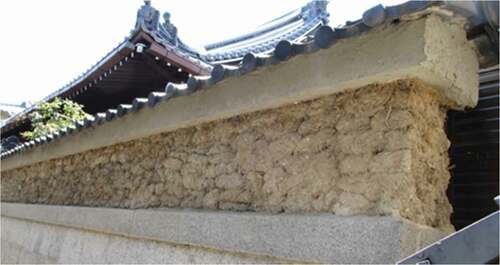
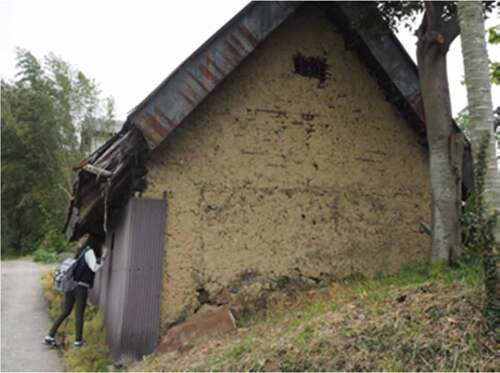
Figure 6. Cob hybrid storehouse in Nara.
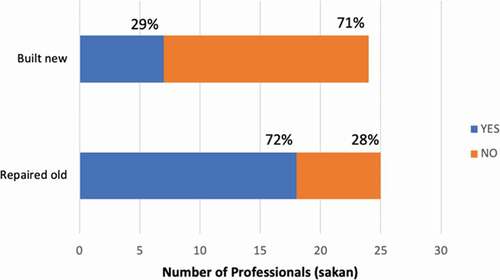
Graph 1. Sakan survey results: experience with cob.
Graph 2. Sakan survey results: experience with cob structures.
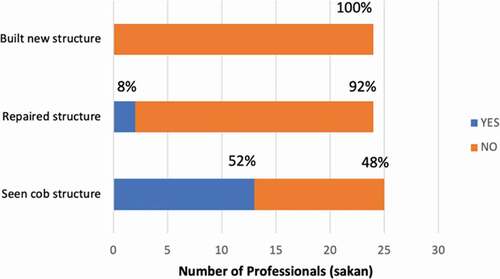
Figure 7. Horyuji perimeter wall replication: (a) shows the laying of freshly made wet adobe bricks. They are being stacked on top of methodically embedded roof tiles; (b) shows the brown coat layer plastered over the bricks after they had dried; (c) shows the finish coat of the professionally built cob perimeter wall. (Photos taken by Miyaoku, J.).
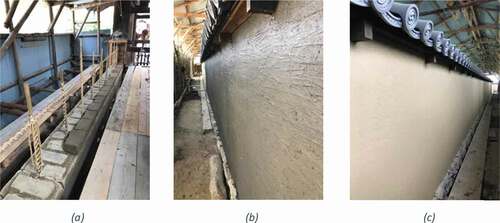
Figure 8. Typical sakan lime finish.
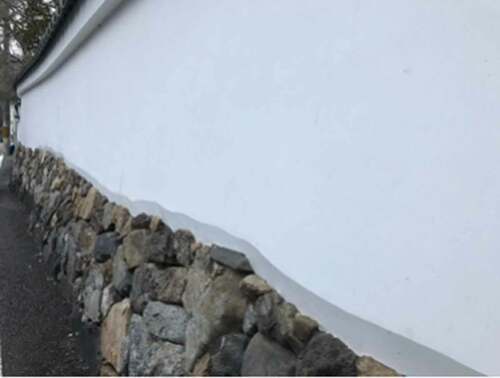
Figure 9. Mid-repair, professional work; stacked tiles visible after 50 mm of surface removal.
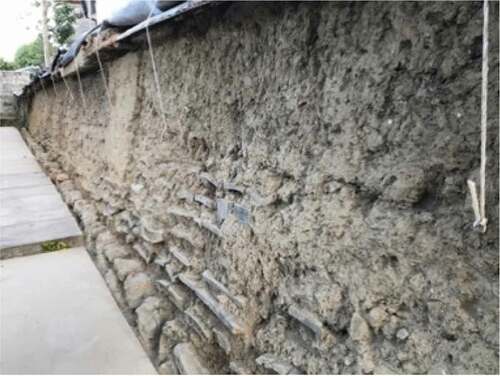
Figure 10. Amateur work using tiles and rocks, etc.
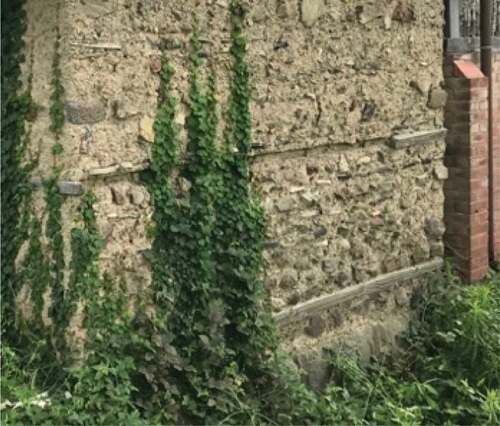
Figure 11. Iwasaki 1, left side wall faces north.
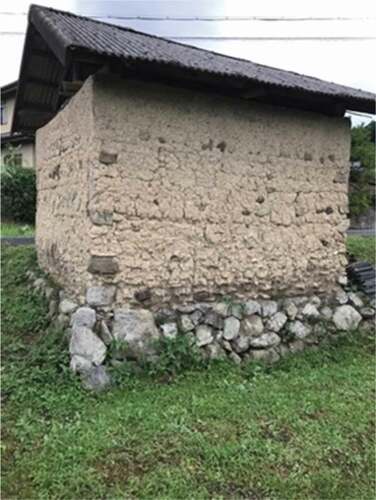
Figure 12. Iwasaki 1 W (lines denote measured lengths).
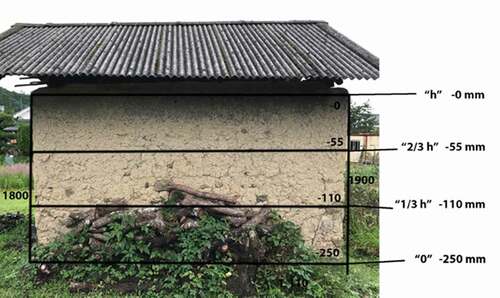
Figure 13. Iwasaki 3, wall faces west.
Figure 14. Wada.
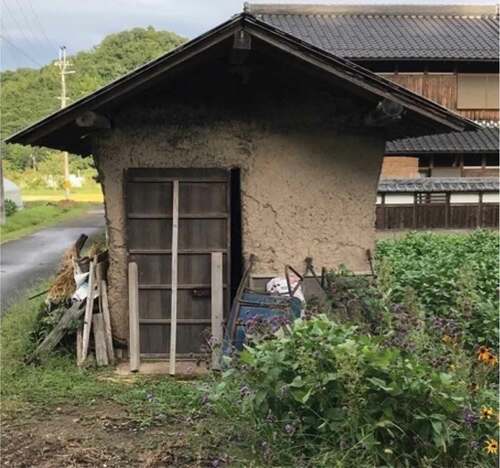
Figure 15. Measuring wall deterioration. (Measurement was taken by drawing a line from the top of the wall to the original location of the footprint of the wall, determined by close observation.).
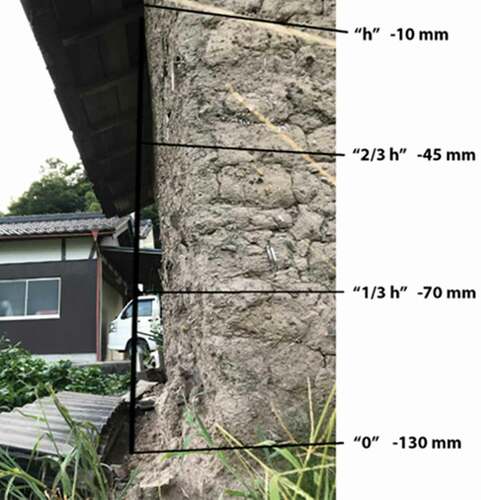
Figure 16. Agatamori.
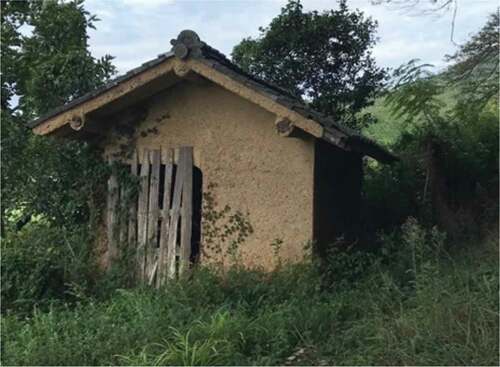
Figure 17. Agatamori E.
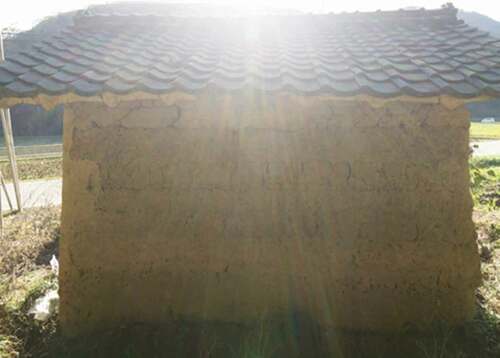
Figure 18. Nakayama 754 S.
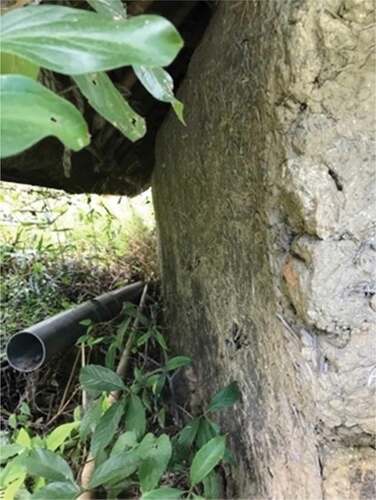
Figure 19. Nakayama 754 E.
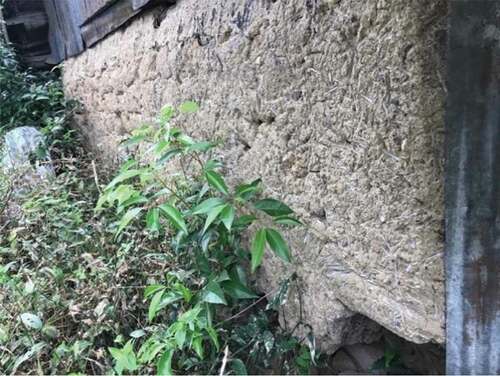
Figure 20. Nakayama 797.
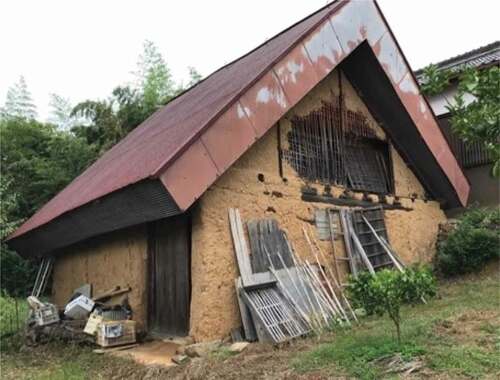
Figure 21. Nakayama 797 S.
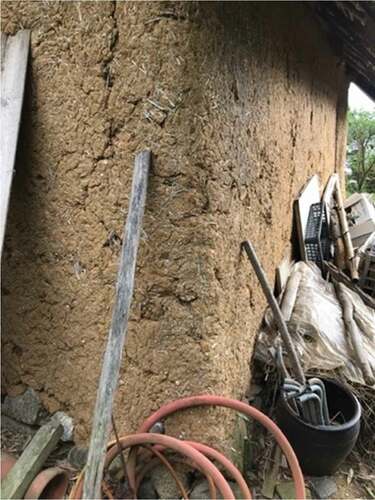
Figure 22. Nakayama 971. The wall to the left faces west, the wall to the right faces south.
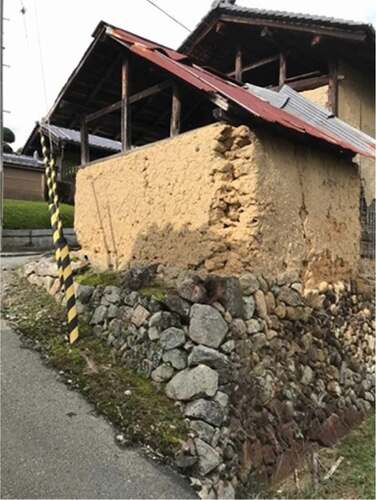
Figure 23. Yanagimoto 602, the side with the tree faces west.
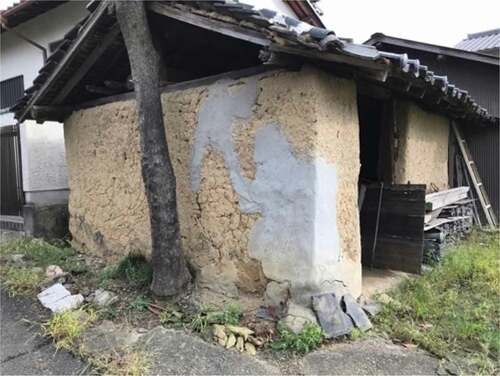
Figure 24. Yanagimoto 602 E.
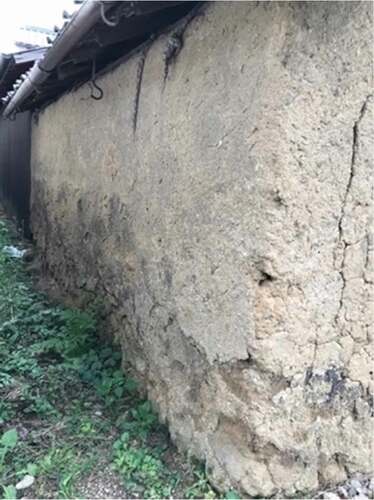
Figure 25. Kamitokura E.
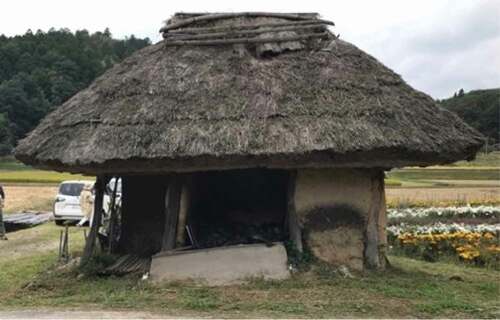
Figure 26. Kamitokura N (right).
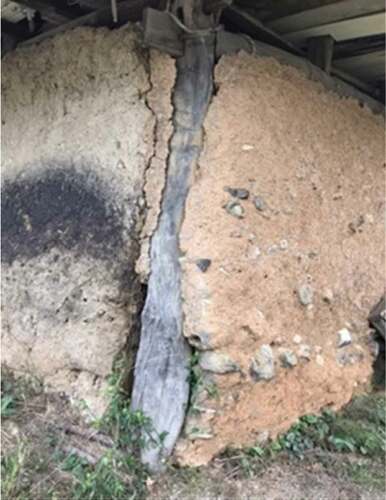
Figure 27. Fukuda.
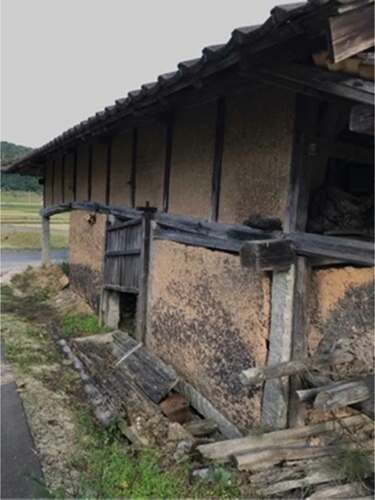
Figure 28. Fukuda N 1.
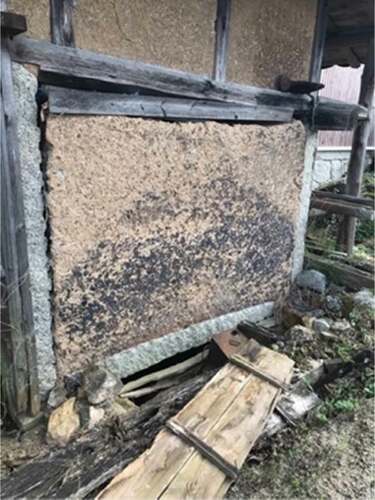
Figure 29. Fukuda N 2.
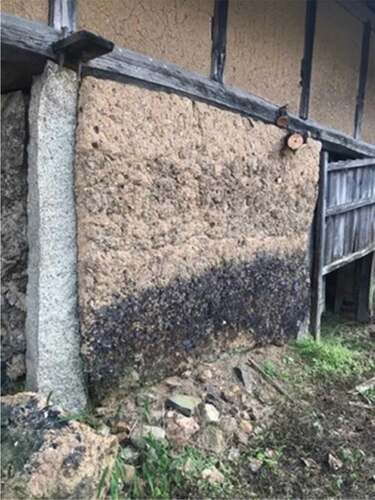
Figure 30. Fukuda in Citation2013 (western-most wall intact) (Google, Citation2013).
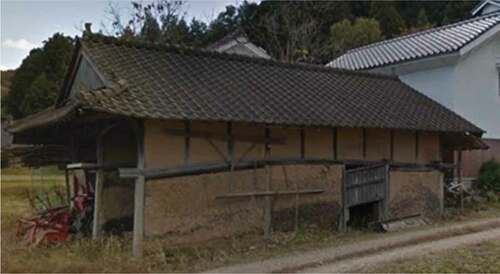
Figure 31. Shimozu. The narrow wall seen in the center faces west. The bottom left side has a stone foundation and the bottom right has no foundation. The wall on the right faces south.
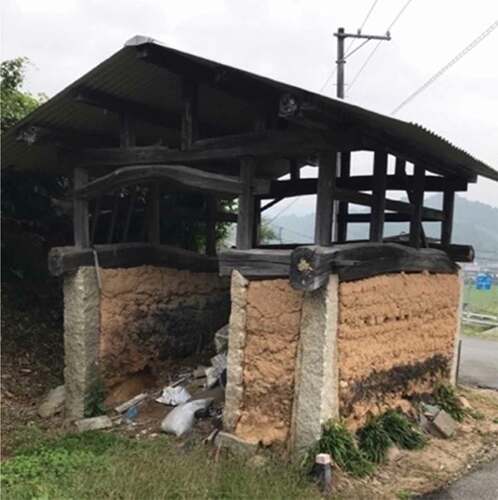
Figure 32. Shimozu N.
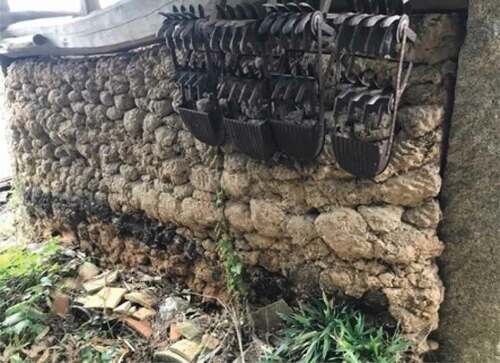
Figure 33. Shimozu S.
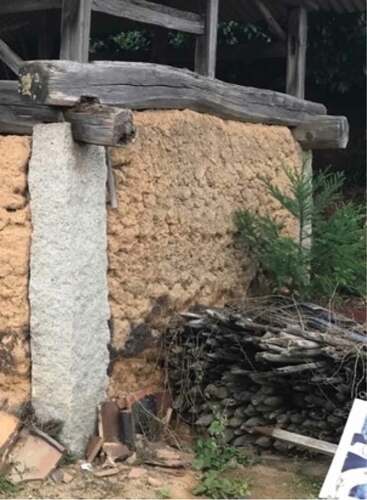
Figure 34. Sakaihara. The wall on the left faces west.
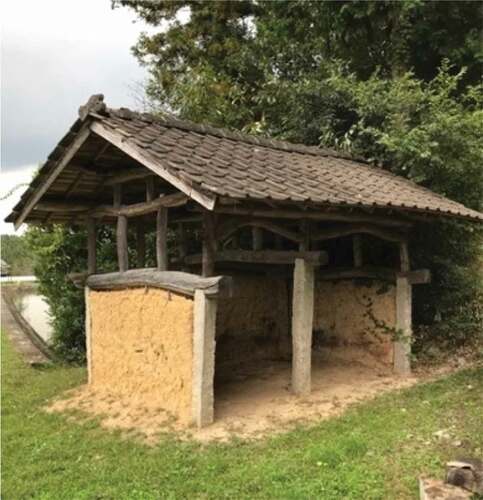
Figure 35. Sakaihara N W.
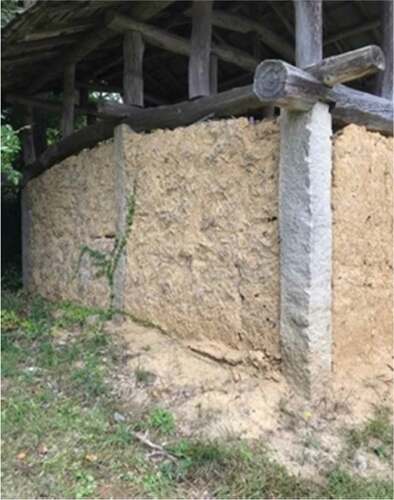
Table 1. Sasayama walls measured for changes in length.
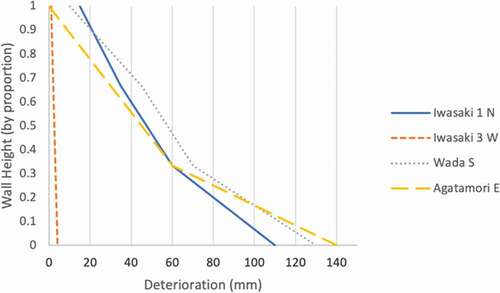
Graph 3. Changes in length, Sasayama walls.
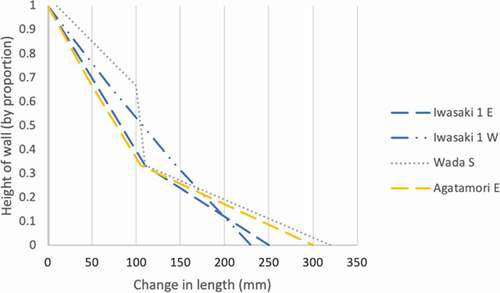
Table 2. Yamanobe-no-michi walls measured for changes in length.
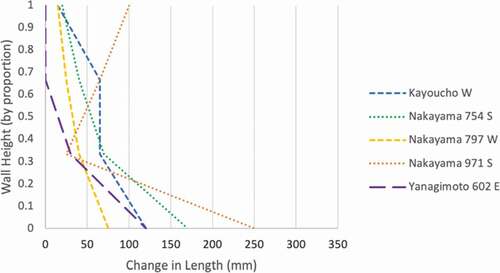
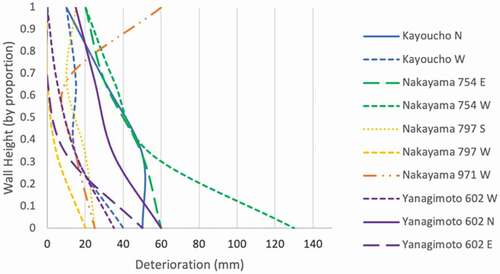
Graph 4. Changes in length, Yamanobe-no-Michi walls.
Graph 5. Changes in wall thickness, Sasayama walls.
Graph 6. Changes in wall thickness, Yamanobe-no-Michi walls.
Graph 7. Changes in wall thickness, Mihara walls.
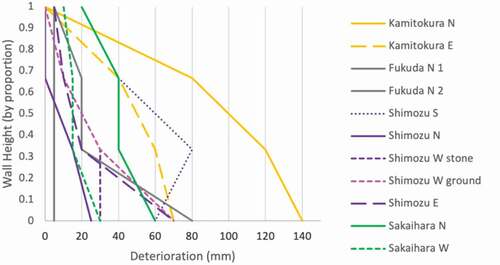
Table 3. Sasayama measurements for surface deterioration.
Table 4. Yamanobe-no-Michi measurements for surface deterioration.
Table 5. Mihara measurements for surface deterioration.
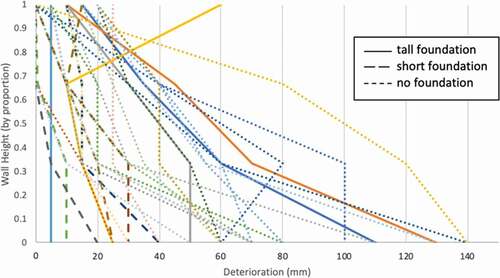
Graph 8. Comparison of surface deterioration according to foundation type.
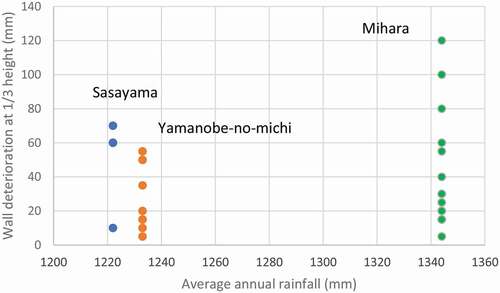
Graph 9. Deterioration in each region according to annual rainfall.