Figures & data
Table 1. The numerical values and the corresponding dominant intensities in pairwise comparison judgments.
Table 2. Random Index (R.I.) of consistency estimation according to matrix size covering this study.
Table 3. Frame of indicators for value assessment of historic building in Hangzhou city China.
Figure 1. An example part of questionnaire.
Figure 2. Comparison matrices of individual expert P1.
Figure 3. Consistent estimation of the comparison matrices of individual expert P1.
Figure 4. The comparison matrices of group decision by assigning experts’ priorities averagely.
Figure 5. Consistent estimation of comparison matrices of group decision by assigning experts’ priorities averagely.
Table 4. Normalization weights of indicators by method 1 (Ua).
Table 5. The dxy according to the iterative clustering steps.
Table 6. Normalization priorities of experts by iterative clustering analysis.
Figure 6. The iterative clustering process.
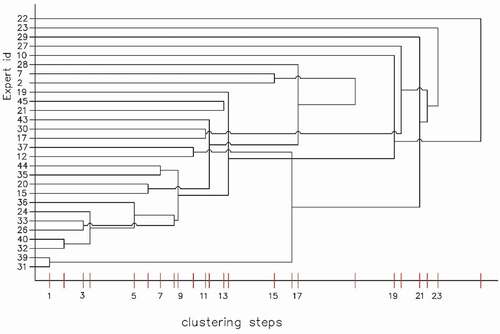
Figure 7. The group comparison matrices by assigning experts’ priorities based on iterative clustering analysis.
Figure 8. Consistent estimation of comparison matrices of group decision by assigning experts’ priorities based on iterative clustering analysis.
Table 7. Normalization weights of indicators by method 2 (Ub).
Table 8. Sequential number of experts (ye).
Figure 9. The group comparison matrices by assigning experts’ priorities based on sequential analysis.
Figure 10. Consistent estimation of comparison matrices of group decision by assigning experts’ priorities based on sequential analysis.
Table 9. Normalization priorities of experts by sequential analysis (βe).
Table 10. Normalization weights of indicators by method 3 (Uc).
Figure 11. Normalization weights of indicators by expert P1.
Figure 12. Normalization weights of indicators by expert P22.
Figure 13. Normalization weights of indicators by method 1.
Figure 14. Normalization weights of indicators by method 2.
Figure 15. Normalization weights of indicators by method 3.
Figure 16. The identification of experts with extremal preference by method 2 and method 3.
Figure 17. The priorities of 9 experts with extremal preference identified by method 2 and method 3.