
Figures & data
Figure 1. Some samples of Orosi windows.
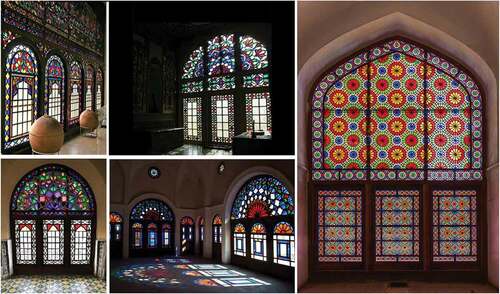
Table 1. Researches on Iranian traditional Orosi.
Figure 2. Plans of the constitution house of Isfahan.
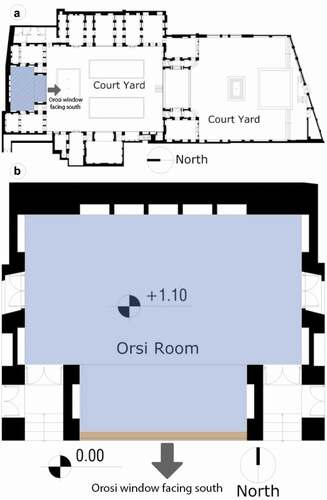
Figure 3. North courtyard of the constitution house. (a) Main plan and (b) Plan of the Orosi room.
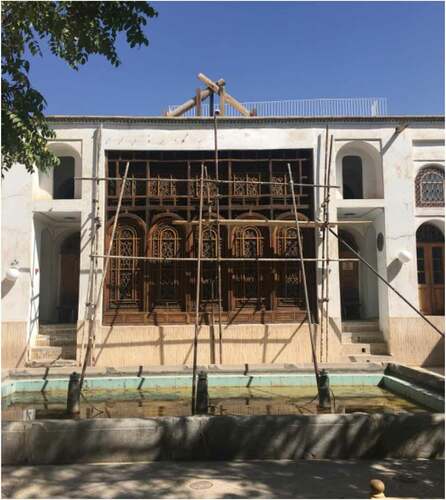
Figure 4. The Orosi space of the Isfahan Constitution House.
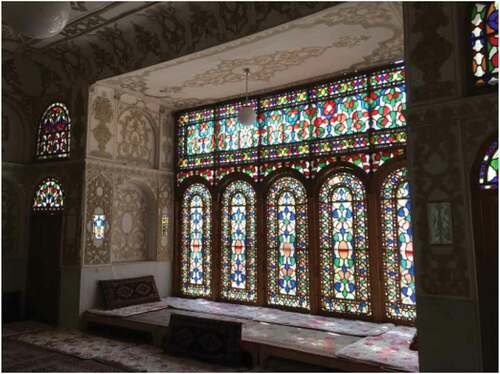
Figure 5. As-built alternative (Alt. 00).
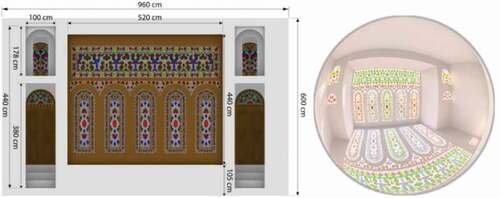
Figure 6. No frame alternative (Alt. 01).
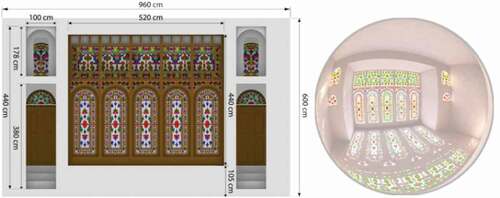
Figure 7. No color alternative (Alt. 02).
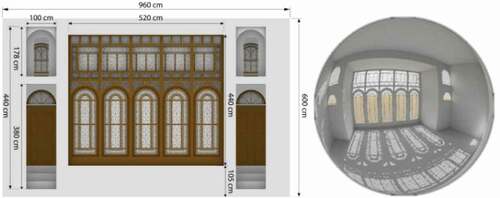
Figure 8. No frame/color alternative (Alt. 03).
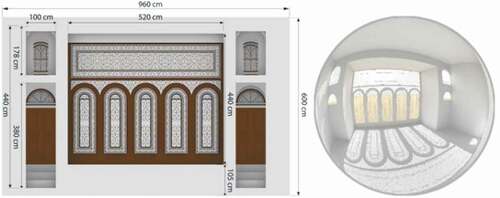
Figure 9. No shape alternative (Alt. 04).
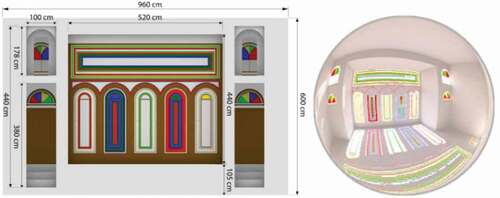
Figure 10. Ordinary window alternative (Alt. 05).
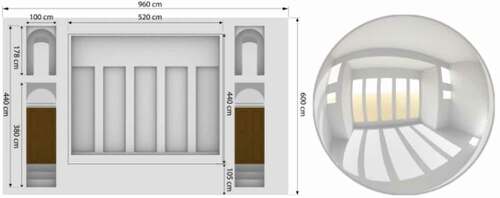
Table 2. Specifications of the Orosi and the alternatives.
Figure 11. 3D model of the Orosi and the interior space.
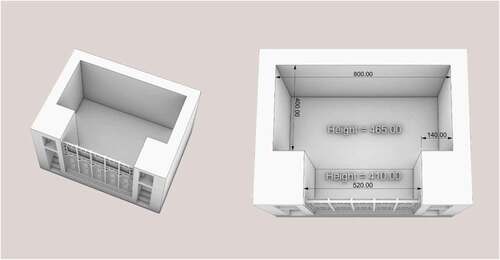
Table 3. The Orosi window specifications.
Table 4. Visible transmittance of tinted glasses.
Table 5. Reflectance of the materials.
Figure 12. Grid point numbers and camera position of the space.
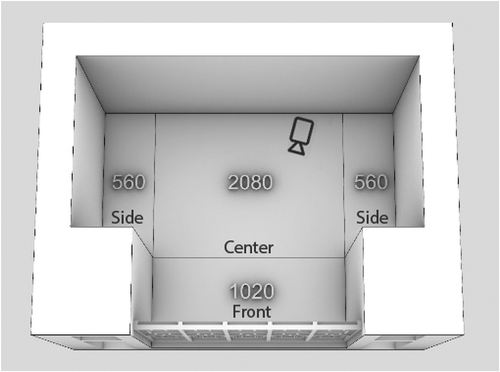
Table 6. DAYSIM simulation settings.
Table 7. Summary of applied daylighting metrics.
Figure 13. Annual daylight illuminance.
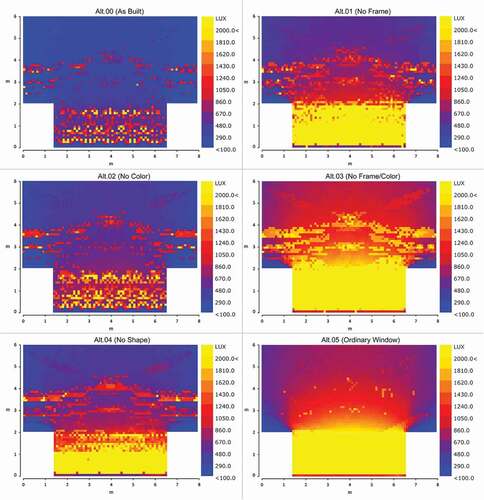
Figure 14. Average daylight illuminance in different space zones.
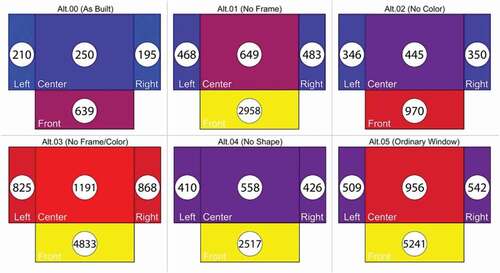
Figure 15. Results of average daylight illuminance.
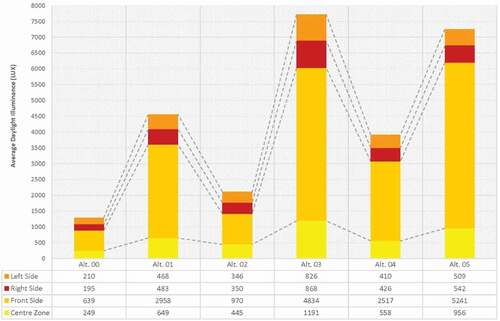
Figure 16. Useful daylight illuminance (UDI).
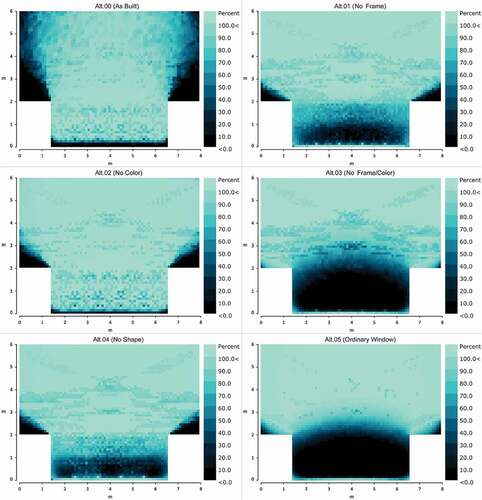
Figure 17. UDI in different space zones.
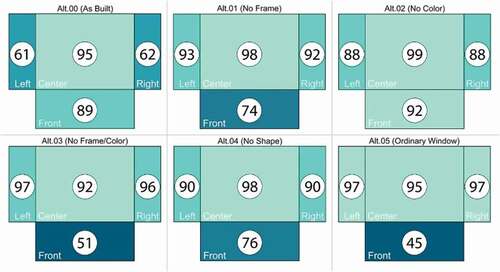
Figure 18. Results of UDI.
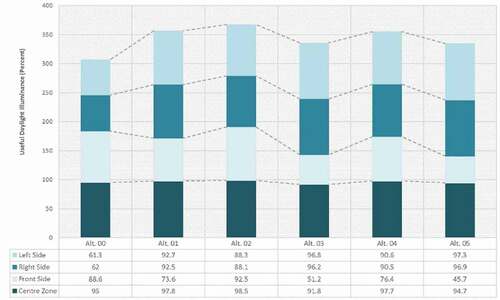
Figure 19. Illuminance ratio.
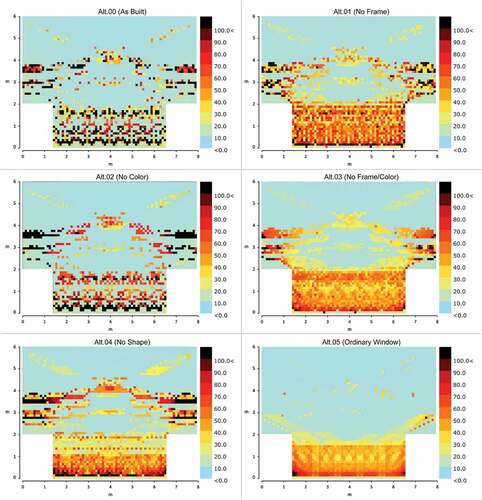
Figure 20. Illuminance ratio in different space zones.
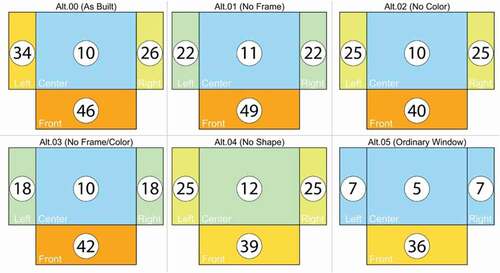
Figure 21. Results of illuminance ratio.
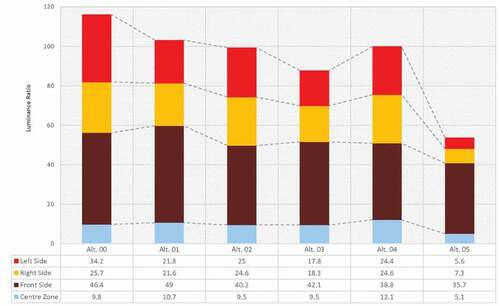
Figure 22. Illuminance ratio changes during a year in the Alt.00.
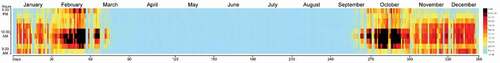
Table 8. Assessment results of each alternative.
Figure 23. DGP results of each alternative.
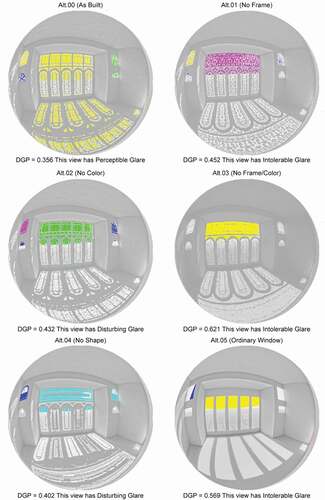
Figure 24. Cumulative comparison between all the alternatives.
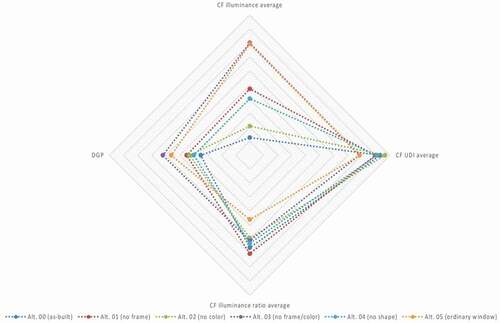
Table 9. Ranking of the highest and lowest performances of the combination of the Orosi elements in each metric based on the reference values of the ordinary window.