Figures & data
Table 1. The size of the Bayun Pagoda in detail.
Figure 1. The Bayun Pagoda.
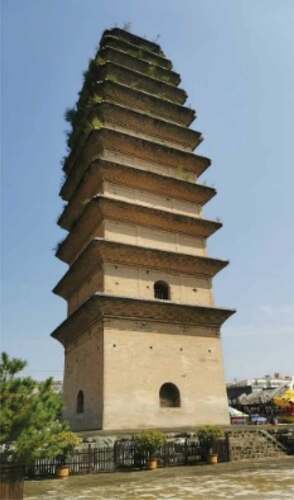
Figure 2. The existing damage of the Bayun Pagoda.
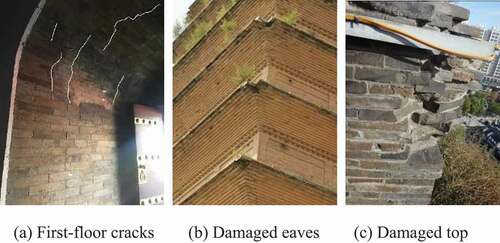
Figure 3. The in-situ dynamic test of the Bayun Pagoda.
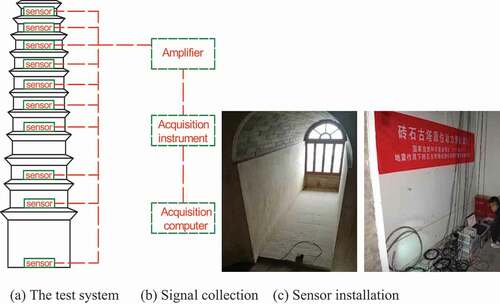
Figure 4. The self-power spectra of the vibration of the Bayun Pagoda.
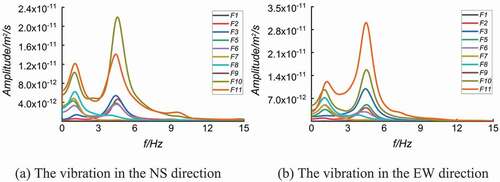
Figure 5. The first and second modes of the Bayun Pagoda.
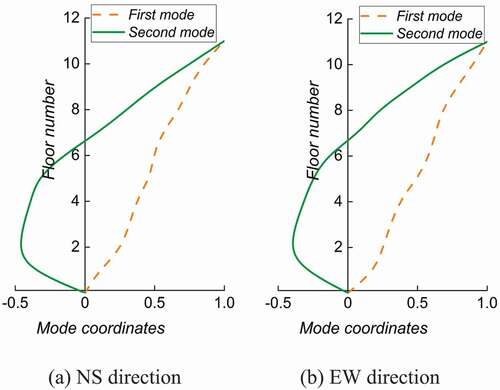
Figure 6. Finite element model of the Bayun Pagoda.
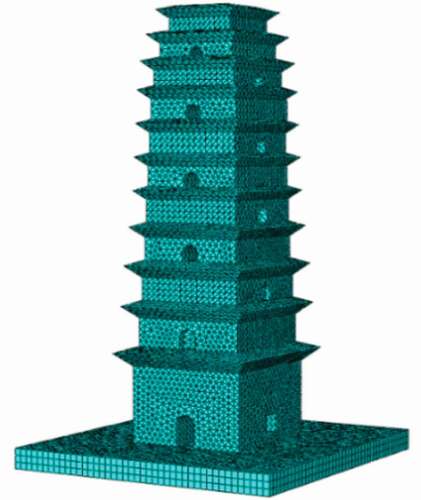
Table 2. A comparative analysis of the finite element simulation and field test results.
Figure 7. Vibration modes of the Bayun Pagoda.
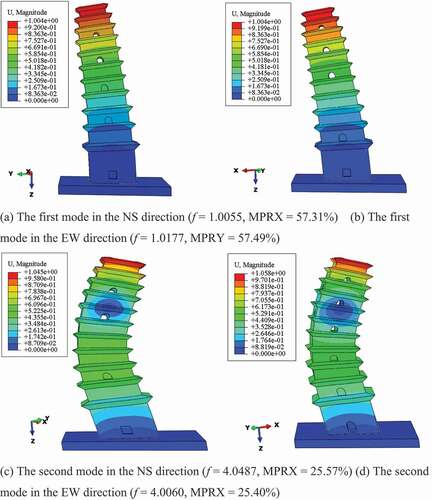
Figure 8. Flexibility curvatures of the Bayun Pagoda in the horizontal directions.
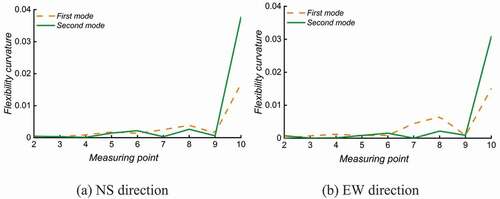
Figure 9. The mutation coefficient of the curvature amplitude in the horizontal directions.
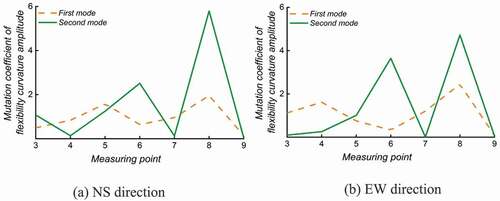
Figure 10. The plastic damage parameters of the masonry.
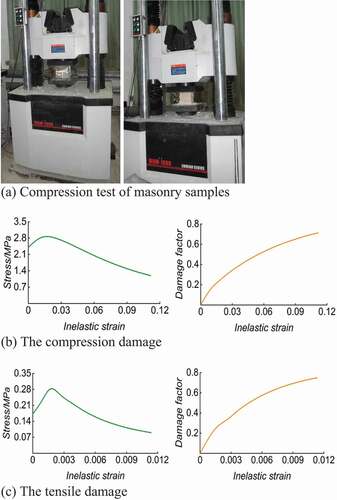
Figure 11. The compressive stress and initial damage of each floor of the Bayun Pagoda.
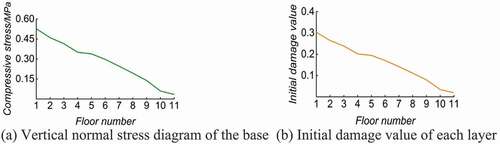
Figure 12. Model of the Bayun Pagoda with initial damage.
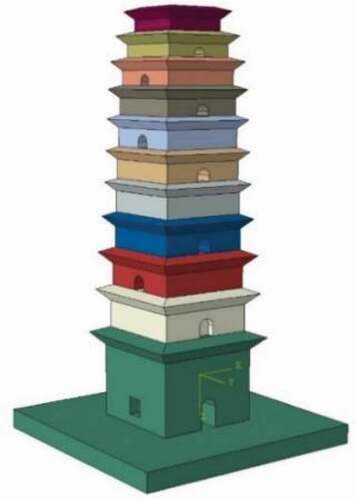
Figure 13. The acceleration time-history curves of three seismic waves.
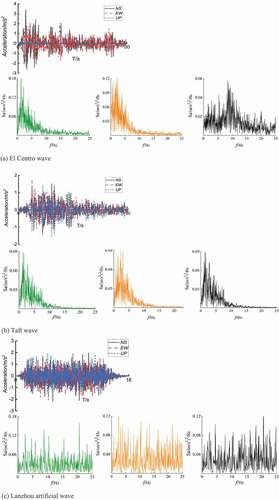
Figure 14. The maximum principal tensile stress affected by the El Centro wave.
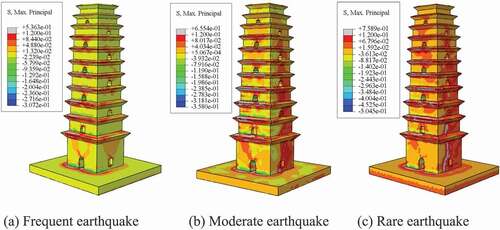
Figure 15. The maximum principal tensile stress affected by the Taft wave.
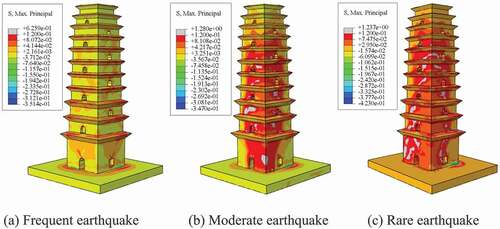
Figure 16. The maximum principal tensile stress affected by the Lanzhou artificial wave.
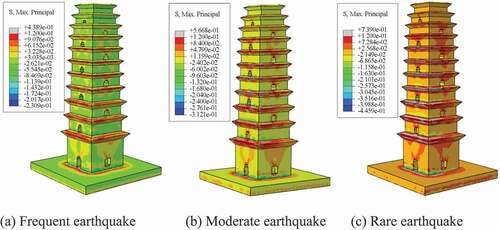
Figure 17. Tensile damage contours affected by the El Centro wave.
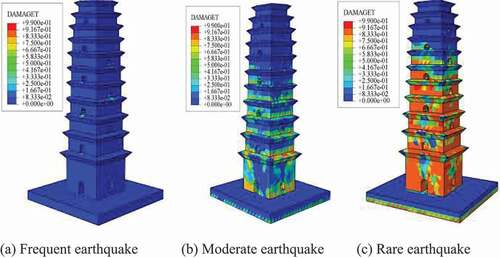
Figure 18. Tensile damage contours affected by the Taft wave.
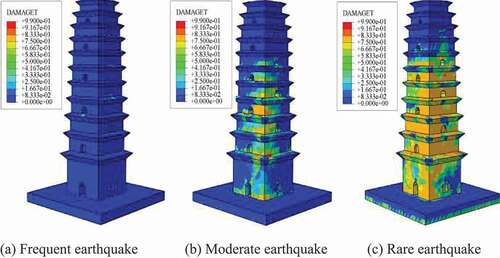
Figure 19. Tensile damage contours affected by the Lanzhou artificial wave.
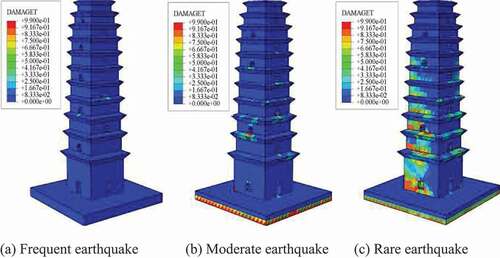
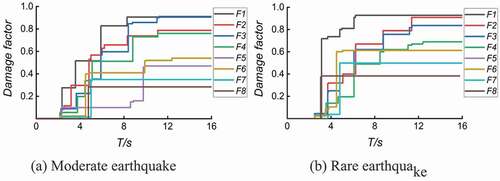
Figure 20. The cumulative damage factor of the Bayun Pagoda affected by the El Centro wave.
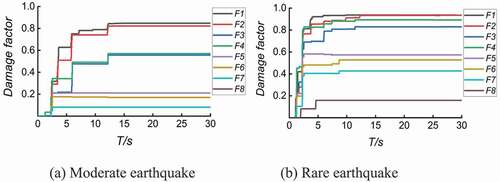
Figure 21. The cumulative damage factor of the Bayun Pagoda affected by the Taft wave.
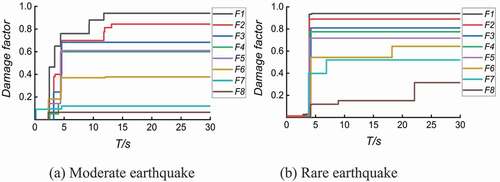
Figure 22. The cumulative damage factor of the Bayun Pagoda affected by the Lanzhou artificial wave.