Figures & data
Table 1. Influencing factors.
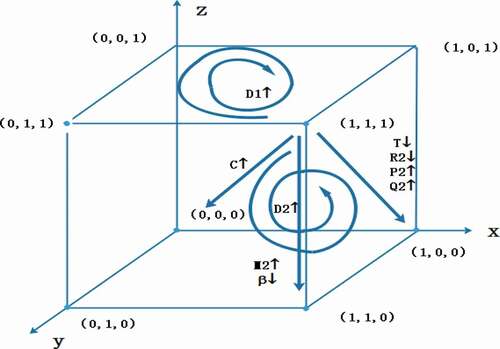
Figure 1. Research framework.
Table 2. Payment matrix of tripartite game.
Table 3. Conditions of stability at equilibrium points.
Table 4. Interviewees.
Figure 2. Evolution of government, owner, and company at , Scenario I: C = 0.15, T = 0.1, D1 = 0.05, D2 = 0.05, R1 = 25, R2 = 25.1, P1 = 21, P2 = 22, Q1 = 1.2, Q2 = 0.5, M1 = 0.1, M2 = 0.25,
.
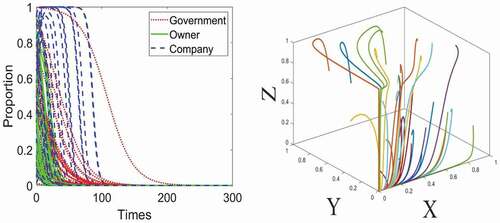
Figure 3. Evolution of government, owner, and company at , Scenario II: C = 0.05, T = 0.1, D1 = 0.05, D2 = 0.05, R1 = 25, R2 = 25.1, P1 = 21, P2 = 22, Q1 = 1.2, Q2 = 0.5, M1 = 0.1, M2 = 0.25,
.
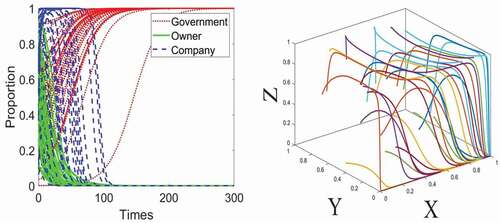
Figure 4. Evolution of government, owner, and company at , Scenario III: C = 0.15, T = 0.1, D1 = 0.05, D2 = 0.05, R1 = 25, R2 = 25.5, P1 = 21, P2 = 22, Q1 = 1.2, Q2 = 0.5, M1 = 0.1, M2 = 1.5,
.
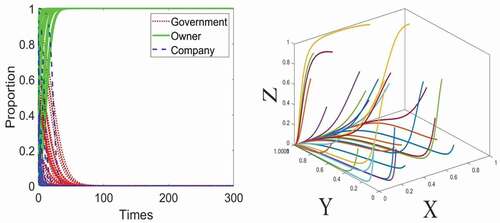
Figure 5. Evolutionary of government, owner, and company at , Scenario IV: C = 0.15, T = 0.3, D1 = 0.05, D2 = 0.05, R1 = 25, R2 = 25.1, P1 = 21, P2 = 22, Q1 = 1.2, Q2 = 0.5, M1 = 0.1, M2 = 1.5,
.
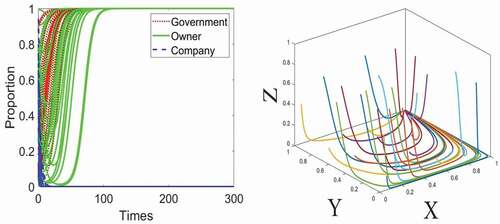
Figure 6. Evolution of government, owner, and company at , Scenario V: C = 0.15, T = 0.1, D1 = 0.05, D2 = 0.05, R1 = 25, R2 = 25.5, P1 = 21, P2 = 22, Q1 = 1.2, Q2 = 0.5, M1 = 0.1, M2 = 0.25,
.
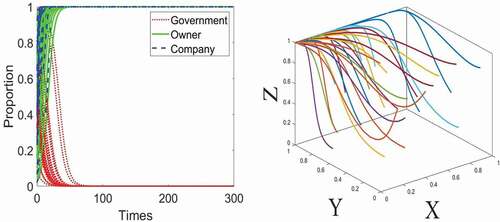
Figure 7. Evolution of government, owner, and company at , Scenario VI: C = 0.15, T = 0.3, D1 = 0.05, D2 = 0.05, R1 = 25, R2 = 25.1, P1 = 21, P2 = 22, Q1 = 1.2, Q2 = 0.5, M1 = 0.1, M2 = 0.25,
.
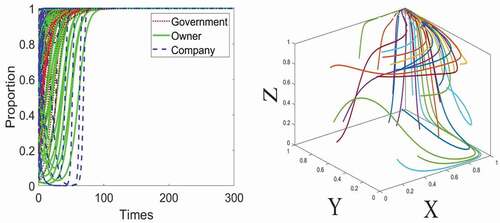
Figure 8. Sensitivity analysis of government, owners, and companies to C.
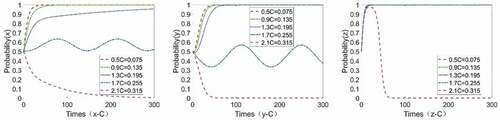
Figure 9. Sensitivity analysis of government, owner, and companies to T.
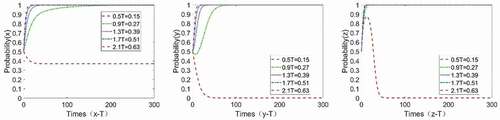
Figure 10. Sensitivity analysis of government, owner, and companies to D1.
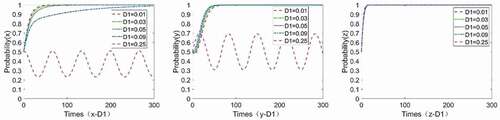
Figure 11. Sensitivity analysis of government, owner, and companies to D2.
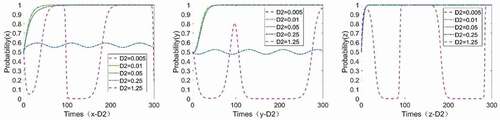
Figure 12. Sensitivity analysis of government, owner, and companies to R2.
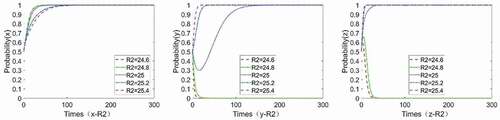
Figure 13. Sensitivity analysis of government, owner, and companies to P2, Q2.
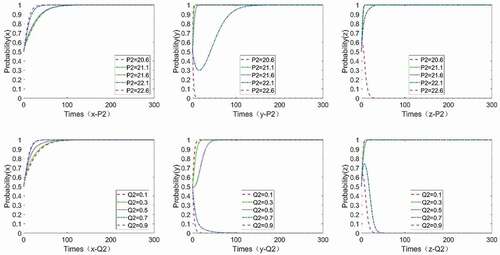
Figure 14. Sensitivity analysis of government, owner, and companies to M2.
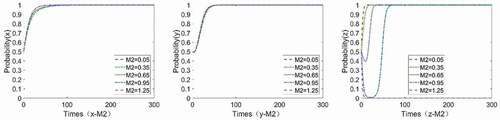
Figure 15. Sensitivity analysis of government, owner, and companies to β.
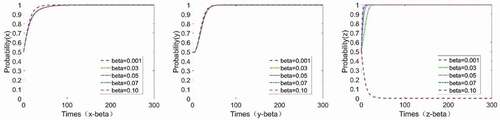
Figure 16. Evolving trend influenced by key parameters.