
Figures & data
Figure 1. SDOF system with bilinear hysteretic model.
Table 1. Selected ductility factor when varying T0 and Cy.
Figure 2. The response spectrum design of Indonesian code.
Table 2. Simulated earthquake ground motions.
Figure 3. Simulation of the acceleration response spectrum.
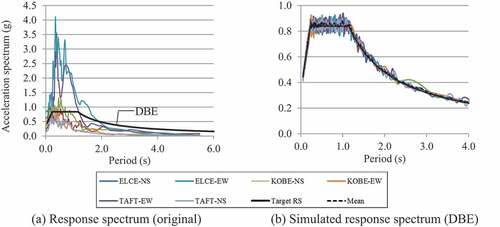
Figure 4. Relationship between shear force coefficient C and ductility factor μ.
Figure 5. Characteristics of maximum displacement.
Table 3. The shear coefficient of C0.
Figure 6. The spectrum of the dynamic seismic index (dIs).
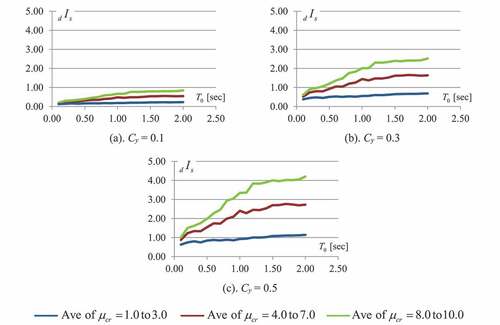
Figure 7. Relationship dynamic ductility index (dF) and critical ductility (μcr).
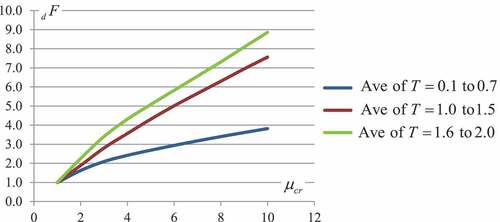
Figure 8. The spectrum of dynamic ductility index (dF).
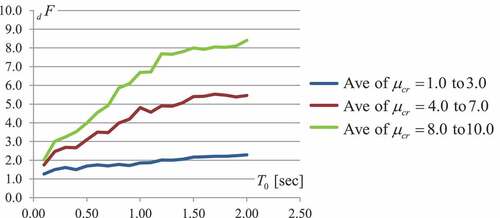
Figure 9. The reliability of the ductility index estimation method with increasing the critical ductility factor.
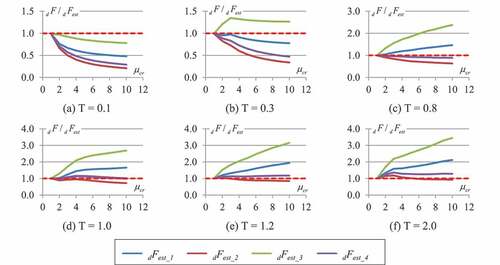
Table 4. The percentage of error estimation for each dF estimation.
Figure 10. Relationship critical ductility factor and dynamic ductility index on several estimation methods.
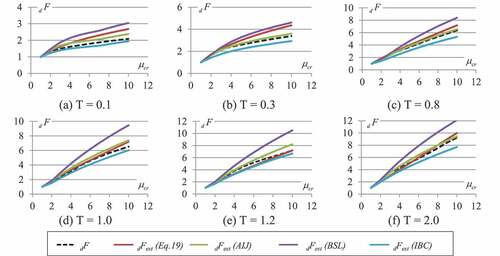
Table 5. The percentage of error comparison for both estimation method.