
Figures & data
Figure 1. Energy consumption in buildings by many energy resources (2010–2050).
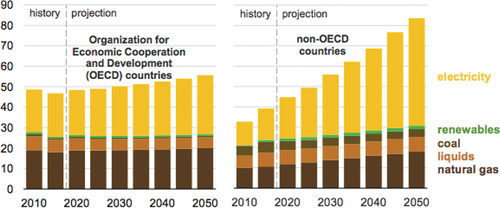
Figure 2. World net electricity production from renewable sources (2010–2050).
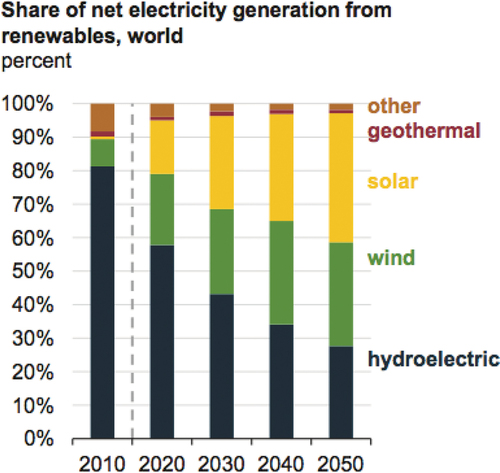
Figure 3. (a) Conceptual double skin smart façade (light-pipes, wind turbines, photovoltaic cells). (b) Schematic building section-drawing showing features of light pipes, wind turbines, and photovoltaics.
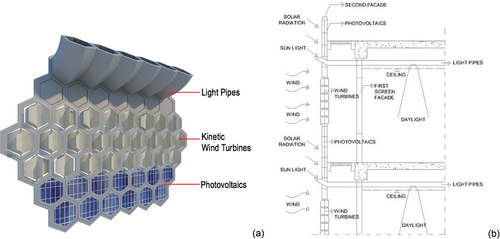
Figure 4. (a) Honeycomb, bees, and honey. (b) Honeycomb smart façade module and electricity.
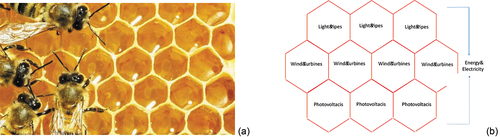
Figure 5. (a) Horizontal and vertical rotating propeller placement. (b) Principles of wind turbine movement in the Savonius System.
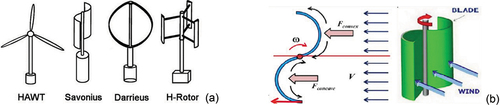
Figure 6. (a) Three Building Integrated Wind Turbine (BIWT) systems using large wind turbines. (b) Two BIWT systems use small sized wind turbines. (Source: Elger et al., Citation2015).
Figure 7. (a) Dimension of honeycomb windmill module. (b) Previous design of savonius wind turbine model. (c) Optimized Savonius wind turbine module with four blades.
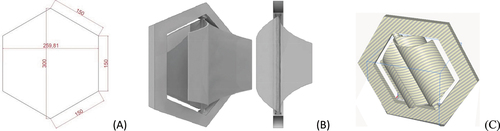
Table 1. Cd values for different body shapes.
Figure 8. Power coefficient against TSR.
Figure 9. Comparison between the simulation results of hexagonal micro wind turbine to Ferrari et al. and Blackwell et al.
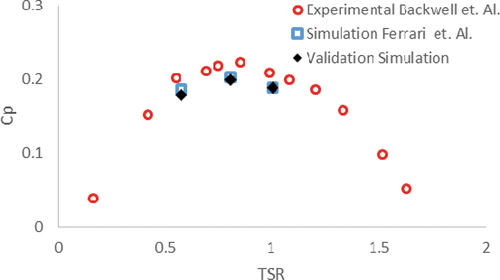
Table 2. Comparison of the simulation validation result with the experiment of the Blackwell, Sheldahl, and Feltz (Citation1977).
Figure 10. (a) Savonius 3D facet 3D model. (b) Savonius 3D meshing model.
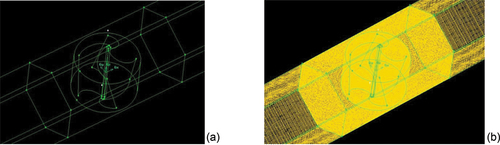
Figure 11. (a) Variation in the radius of the turbines. (b) Variation in offset of the turbines. (c) Variations in twist of the turbines.
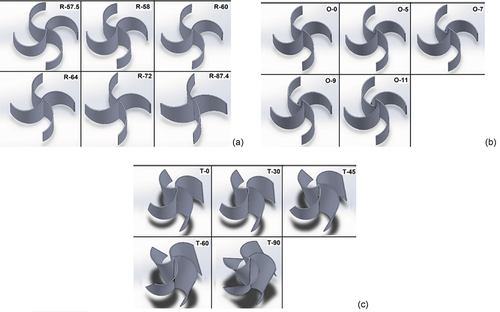
Figure 12. (a) Vector velocity of wind flow on a 58 mm radius turbine. (b) Turbulent kinetic energy in a 58 mm radius turbine.
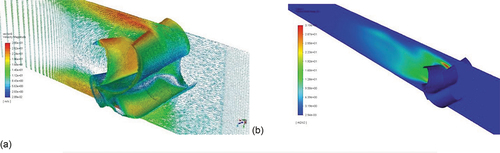
Figure 13. Variants of turbine blade radius.
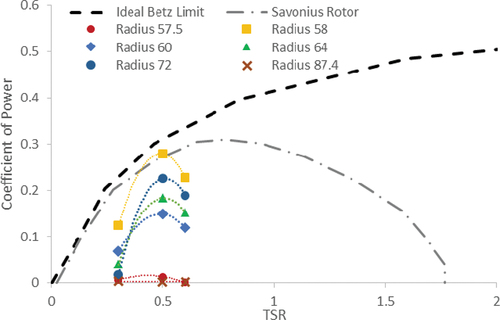
Table 3. Variations in turbine blade radius.
Figure 14. (a) Vector velocity of wind flow on an 11 mm offset turbine. (b) Turbulent kinetic energy in turbine offset 11 mm.
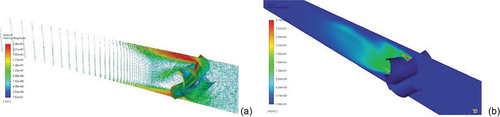
Figure 15. Variants of turbine blade offset (Source: Author).
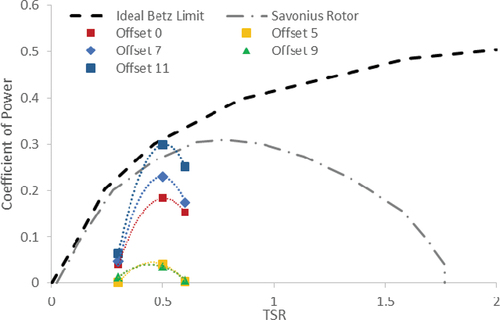
Table 4. Variations in turbine blade offset.
Figure 16. (a) Vector speed of wind flow on turbine twist 0°. (b) Turbulent kinetic energy in turbine twist 0°.
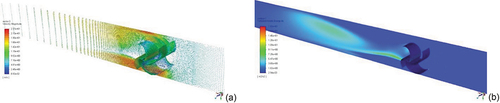
Figure 17. Variants of turbine blade twist.
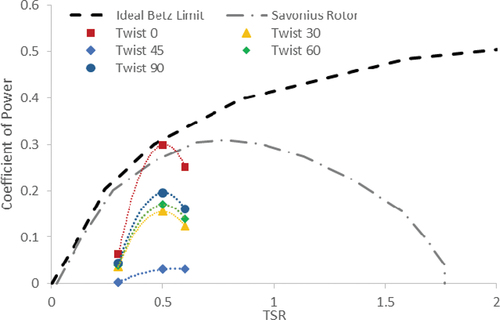
Table 5. Variations in turbine blade twist.
Figure 18. Hexagonal turbine optimum model.
Table 6. Variations in turbine blade TSR.