Figures & data
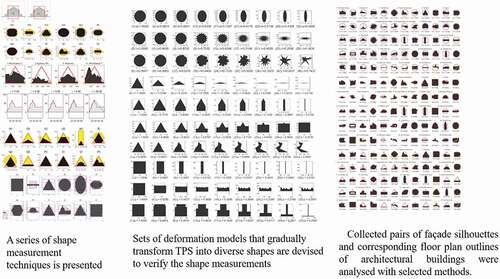
Figure 1. Façade shapes of Ronchamp Chapel and Guggenheim Museum Bilbao
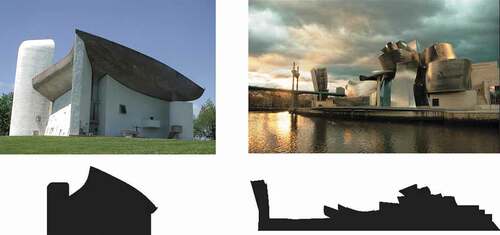
Table 1. Measurements of circularity
Table 2. Measurements of triangularity
Table 3. Measurements of squareness
Figure 2. Line simplification
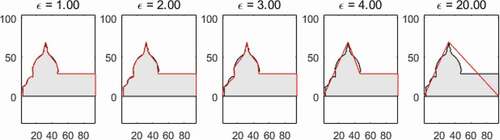
Figure 3. Examples of polygon approximation
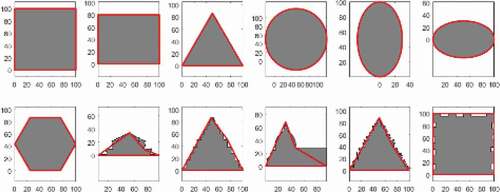
Figure 4. Boolean operations of two overlaid polygon
Figure 5. Reference circles with variant shapes for the circularity measurements
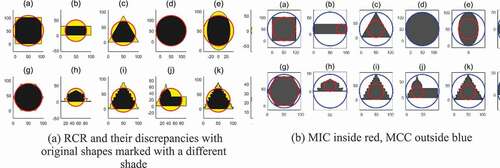
Figure 6. (a) RT and (b) RTE of four building facades. (c) RTE and (d) RTA of twelve geometries. The shaded region indicates the discrepancy area while the region filled with solid black indicates the overlapping area
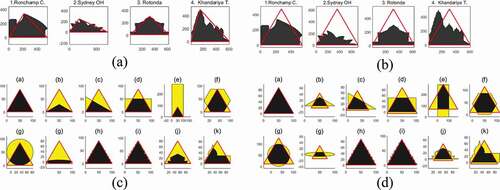
Figure 7. Reference shapes for the squareness measurements; CH, AABB, RSA, RSD, RRD marked in different line styles
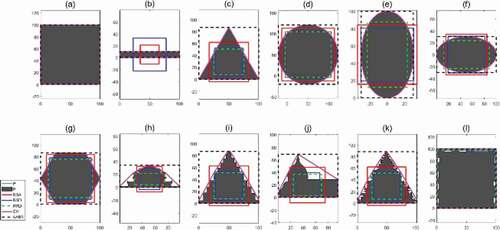
Figure 8. The process of building RSD
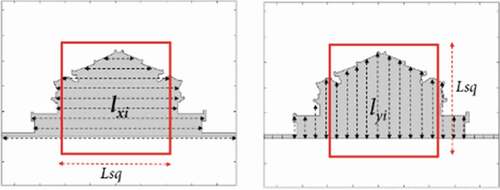
Figure 9. The regions of the exclusive area between RSA and P on the left and RSD and P on the right. The shaded region indicates discrepancy while the solid black indicates the overlapping area
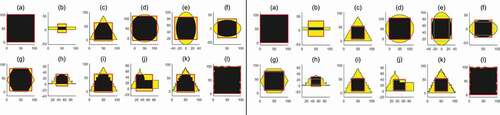
Figure 10. Deformations of a reference shape at regular intervals and their correlations with the measures of circularity
Figure 11. Deformations of a reference shape at regular intervals and their correlations with the measures of triangularity
Figure 12. Deformations of a reference shape at regular intervals and their correlations with the measures of squareness
Table 4. Correlation coefficients between the measurement methods of circularity and the degrees of deformation with known intervals in a circle
Table 5. Correlation coefficients between the measurement methods of circularity and the degrees of deformation with known intervals from an equilateral triangle
Table 6. Correlation coefficients between the measurement methods of circularity and the degrees of deformation with known intervals from a square
Table 7. Mean of R squared between the measurement methods and the degrees of deformation
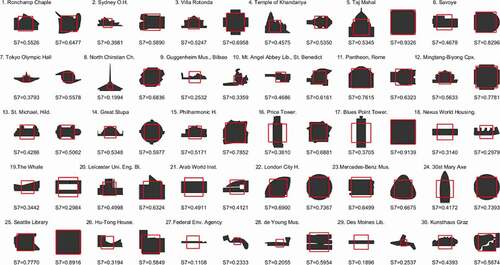
Table 8. Shape measurements of 30 buildings classified into two types of shapes
Figure 13. Circularity measured using the C10 method with reference circle MCC
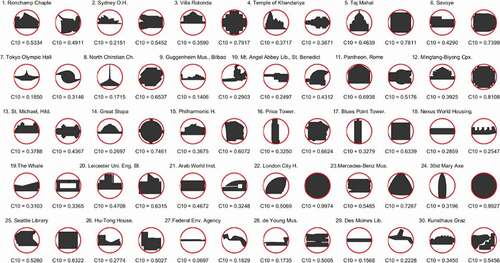
Figure 14. Triangularity measured using the T6 method with the reference equilateral-triangle RET
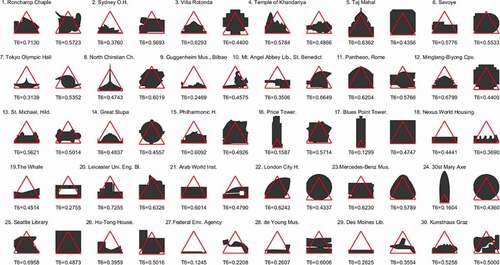
Figure 15. Triangularity measured using the T6 method with the reference equilateral-triangle RET