
Figures & data
Figure 1. The construction scale in every year (2015–2020).
Figure 2. The main works at each stage of the life cycle of the urban underground utility tunnel.
Table 1. Safety classification standards of utility tunnel.
Table 2. Grey classification and value range.
Figure 3. Graph of the triangular center-point mixed whitening weight functions.
Table 3. Sources of the whole life cycle safety evaluation indexes r of utility tunnel.
Table 4. The whole life cycle safety evaluation index system of utility tunnel.
Figure 4. Schematic diagram of underground utility tunnel.
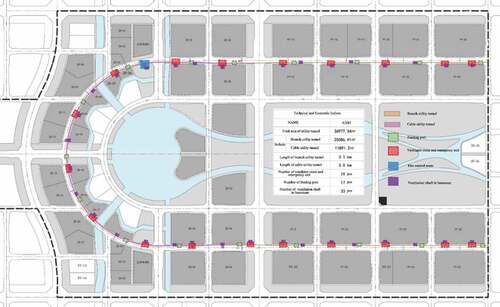
Figure 5. Graph of the vertical section of standard section of branch line.
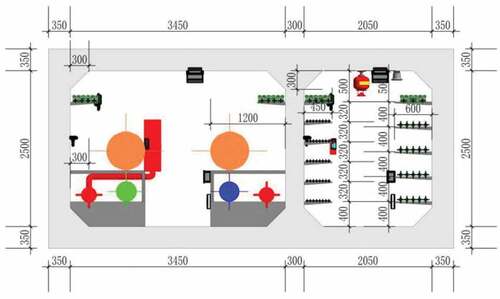
Table 5. The whole life cycle safety index system weight of utility tunnel.
Table 6. Whitenization weight values and comprehensive clustering coefficients of indices. (A11-A16).
Table 7. Comprehensive grey clustering coefficient table.