
Figures & data
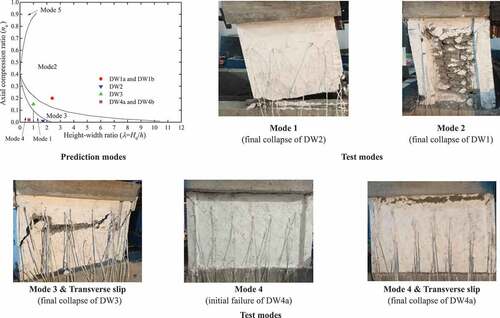
Figure 1. Buildings collapsed in Mexico earthquake (1985).
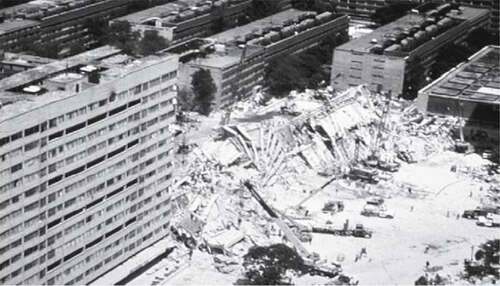
Figure 2. Buildings collapsed in Wenchuan earthquake (2008).
Figure 3. Buildings collapsed in Japan earthquake.
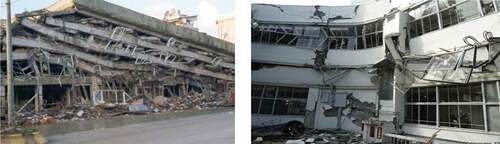
Figure 4. Prediction for typical collapse modes of RC shear walls.
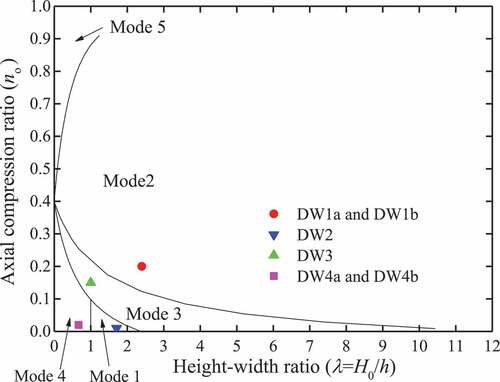
Figure 5. Collapse modes of RC shear walls. (a) Collapse mode 1, (b) collapse mode 2, (c) collapse mode 3, (d) collapse mode 4, and (e) collapse mode 5.
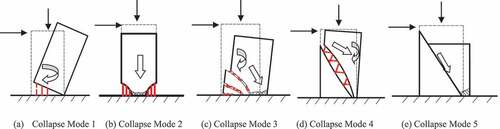
Table 1. The sectional size and the reinforcement of the beams and columns in the model structure.
Table 2. The reinforcement of the model structure.
Table 3. Model parameters and the prediction mode.
Figure 6. The DW1a and DW1b model structures.
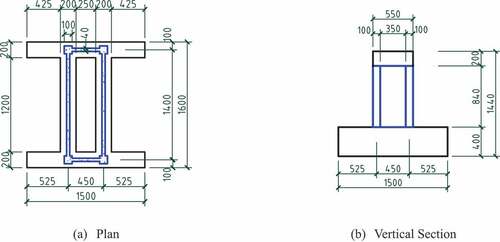
Figure 7. The W2 model structure.
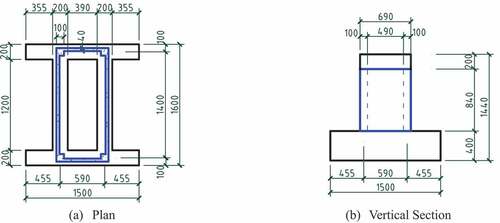
Figure 8. The DW3 model structure.
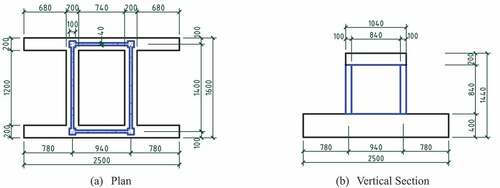
Figure 9. The DW4a and DW4b model structures.
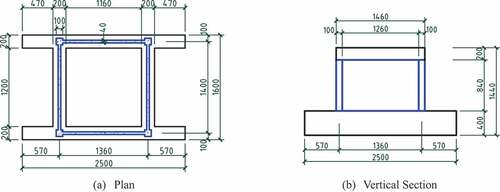
Figure 10. Assembling bar of beam and wall.
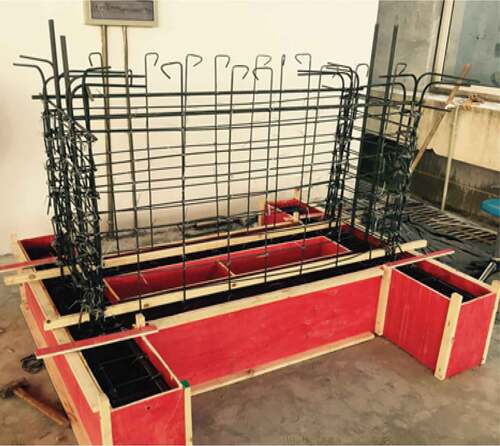
Figure 11. Pouring concrete of beam and wall.
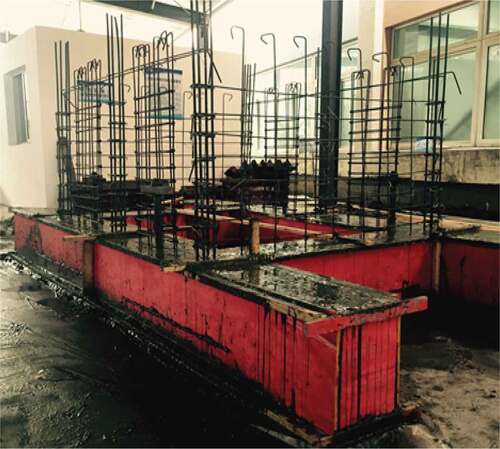
Figure 12. Installing wall model.
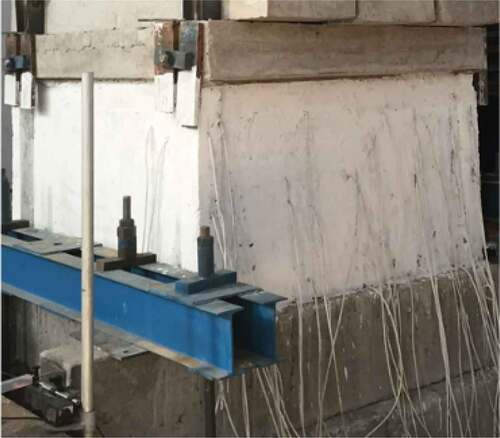
Figure 13. Stress-strain curve of C10 concrete.
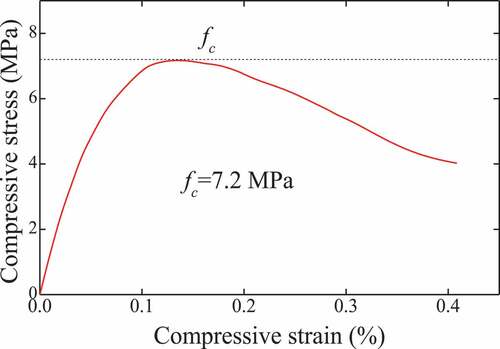
Figure 14. Stress–strain curve of HPB235 steel.
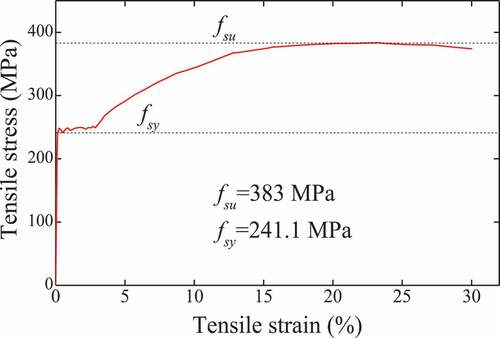
Figure 15. Arrangement of strain gauges.
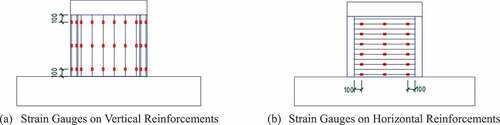
Figure 16. Schematic diagram of loading device.
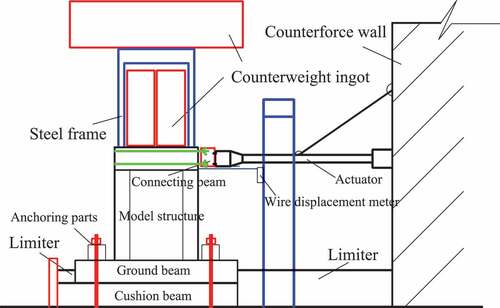
Figure 17. Picture of test equipment.
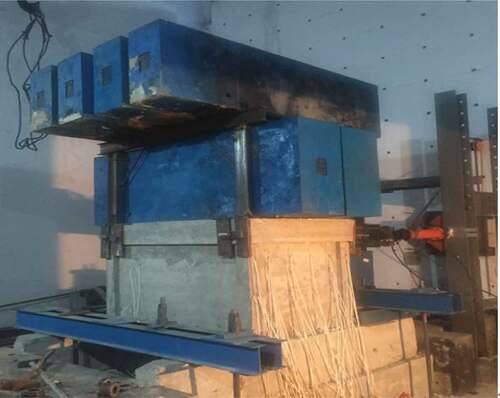
Figure 18. The cyclic loading programme.
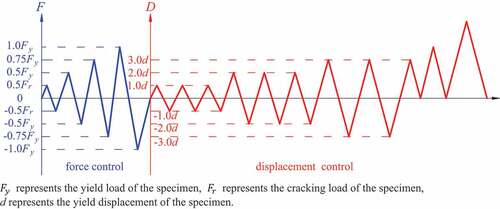
Figure 19. The failure process in the DW1a model.
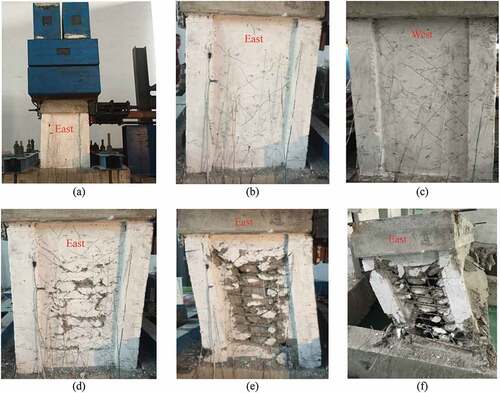
Figure 20. The hysteretic curve of DW1a.
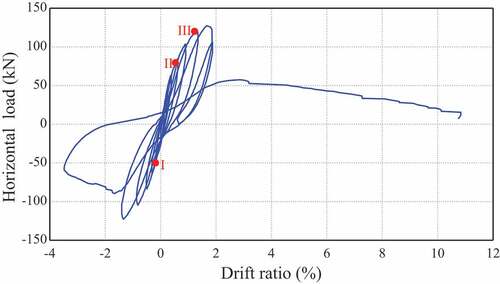
Figure 21. The schematic diagram of the cracks in DW1a.
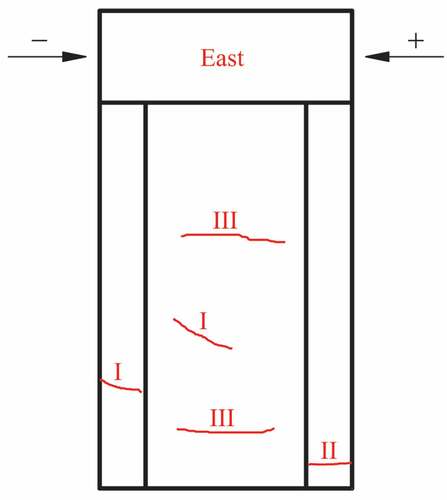
Figure 22. The failure process of model DW1b.
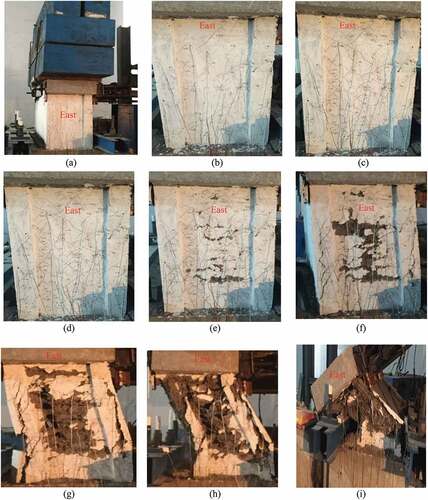
Figure 23. Hysteretic curve of DW1b.
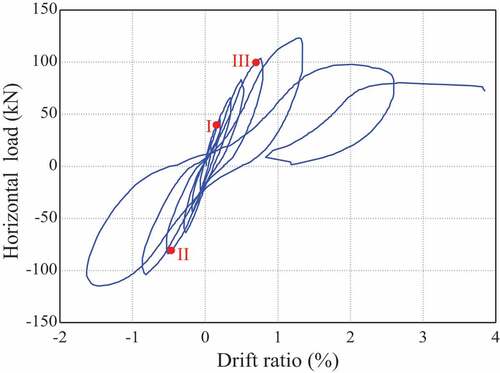
Figure 24. Schematic diagram of cracks in DW1b.
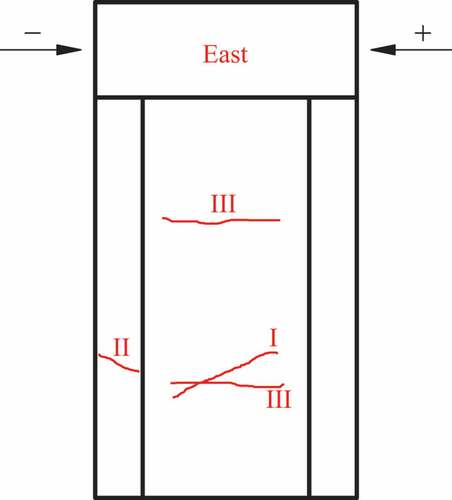
Figure 25. The failure process in the DW2 model.
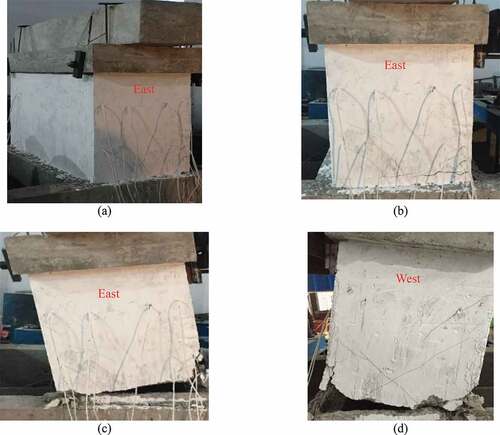
Figure 26. The hysteretic curve of DW2.
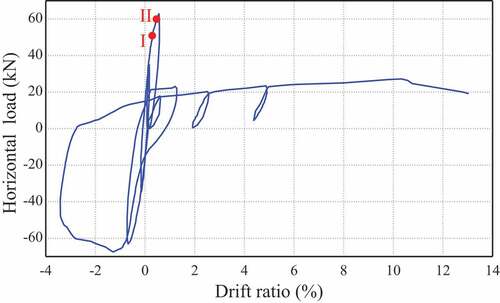
Figure 27. The schematic diagram of cracks in DW2.
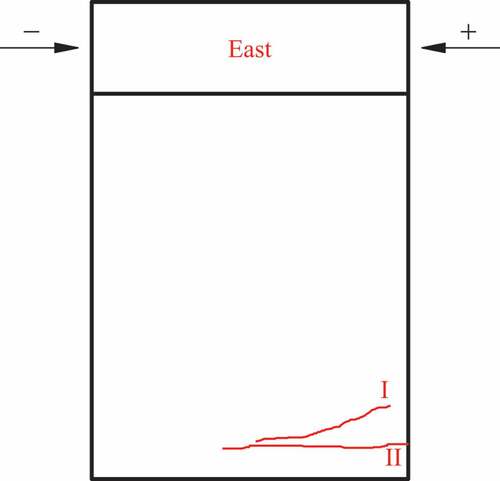
Figure 28. The Failure process in the DW3 model.
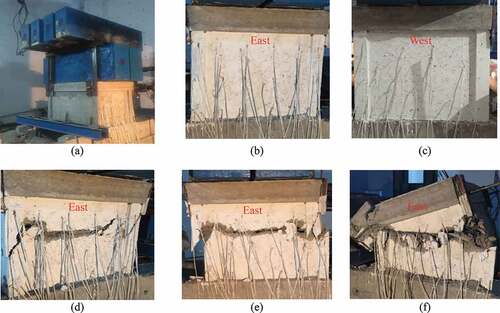
Figure 29. The hysteretic curve of DW3.
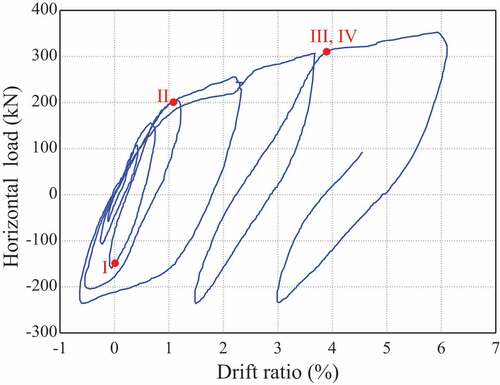
Figure 30. The schematic diagram of cracks in DW3.
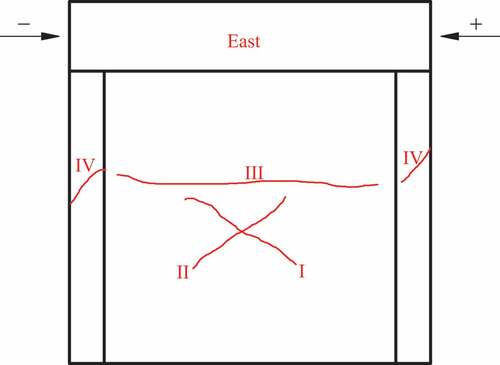
Figure 31. The failure process of model DW4a.
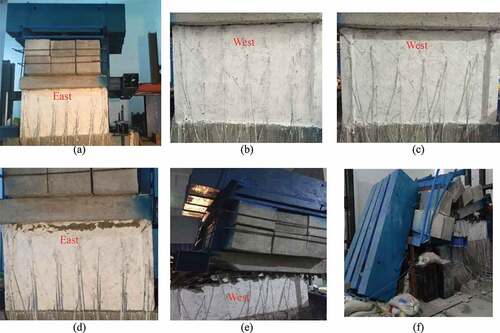
Figure 32. Hysteretic curve of DW4a.
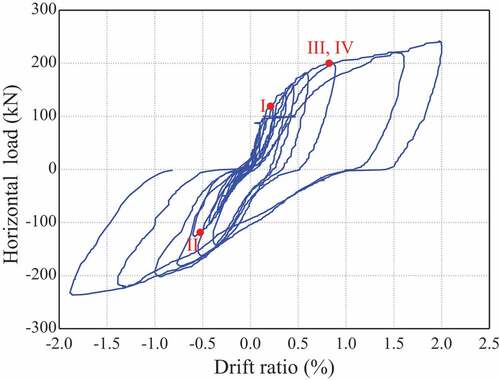
Figure 33. Schematic diagram of cracks in DW4a.
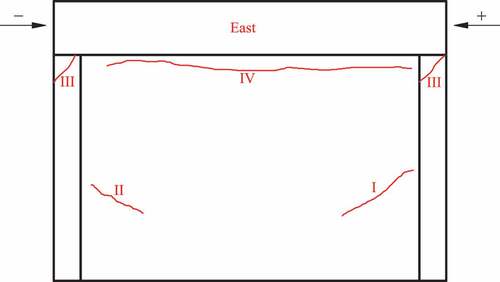
Figure 34. The failure process of model DW4b.
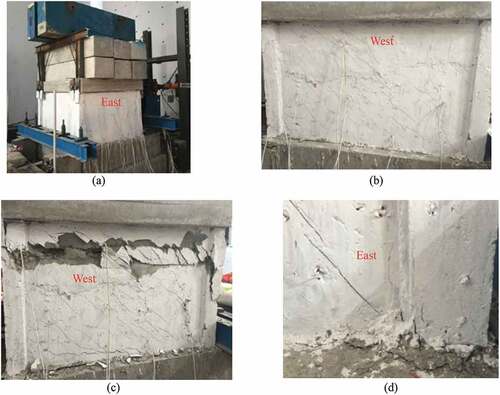
Figure 35. Hysteretic curve of DW4b.
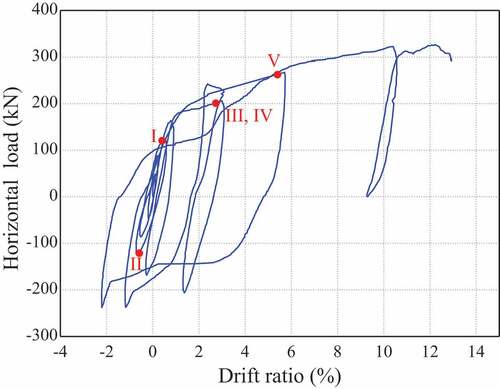
Figure 36. Schematic diagram of cracks in DW4b.
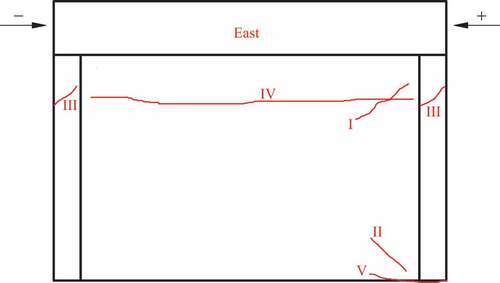
Table 4. Peak load and displacement.