
Figures & data
Figure 1. Ambient temperature and air quality fluctuations with time in Shihezi in recent four years. All data are summarized from China national meteorological information center.
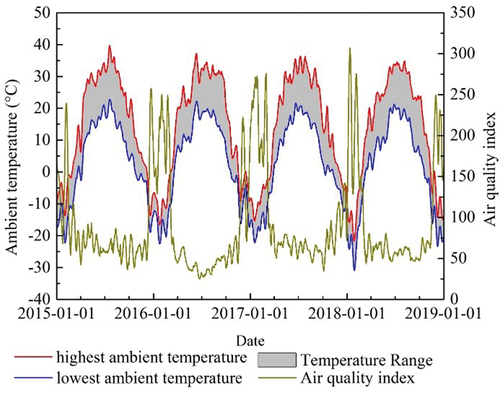
Figure 2. Schematic layout of the experimental set-up for the SAHP system. Supply fluids was painted red and flow back fluids was painted blue.
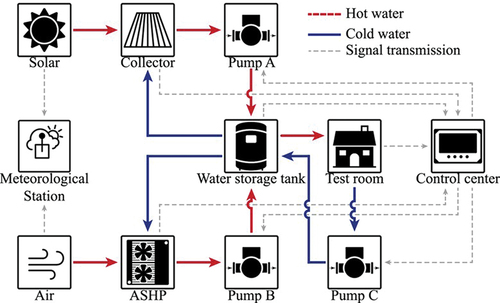
Figure 3. The main composition of SAHP system. (a) Solar collectors. (b) ASHP system. (c) The water storage tank (d) RFH system.
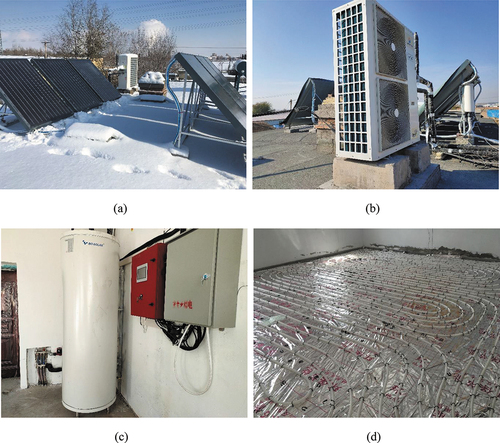
Figure 4. Details of the experimental room.
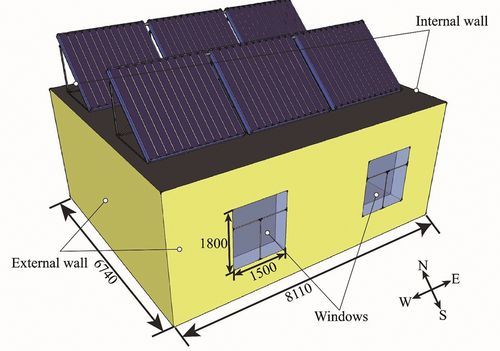
Figure 5. Photo of the experimental office room. (a) Pre-renovation test building in August 2018. (b) Testing building after renovation in April 2019.
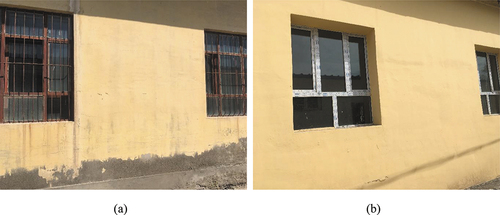
Figure 6. Control logic diagram of control center. Control program was written by GX-Works2 software. USB/485 Converter was used to connect computers and read secure digital memory cards.
Figure 7. Indoor instrument arrangement.
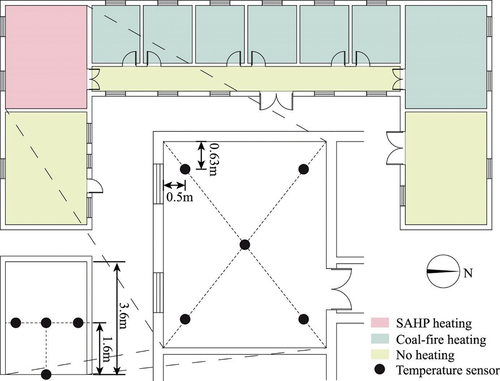
Table 1. Test instruments and parameter accuracy.
Figure 8. Operating variations of the solar collectors from SCP and BCP. (a) Temperature on October 25th, 2018 of SCP. (b) Temperature on December 7th, 2018 of BCP. (c) Solar power on October 25th, 2018 of SCP. (d) Solar power on December 7th, 2018 of BCP.
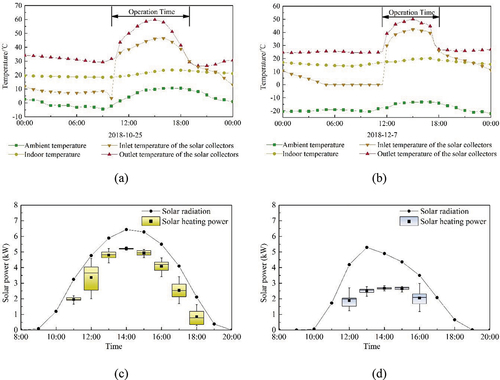
Figure 9. Energy gain of solar collectors with the change of horizontal radiation
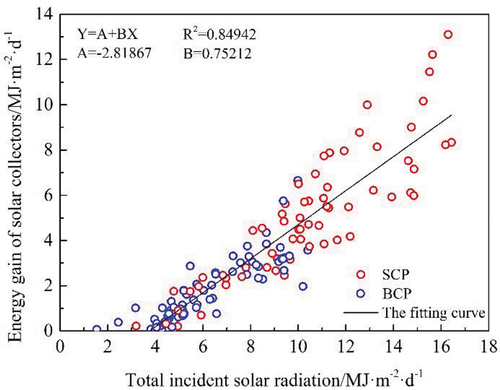
Figure 10. Operating variations of the ASHP system from SCP and BCP. (a) Temperature on November 12th, 2018 of SCP. (b) Temperature on December 13th, 2018 of BCP. (c) Power on November 12th, 2018 of SCP. (d) Power on December 13th, 2018 of BCP.
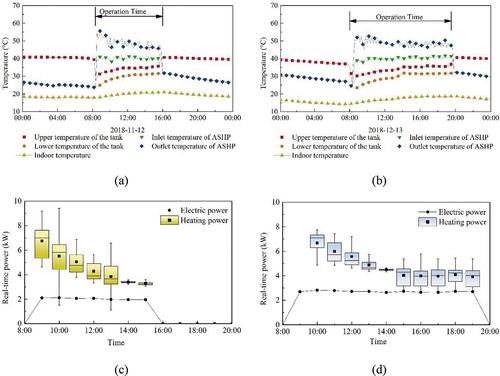
Figure 11. COP of the ASHP system with the change of ambient temperature
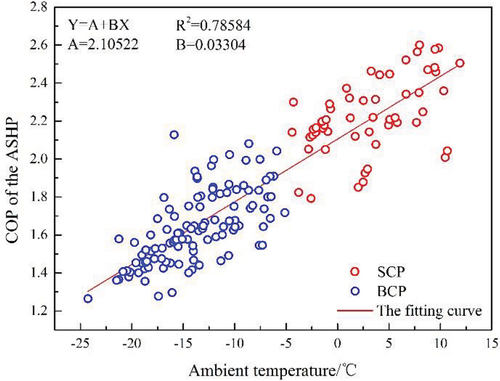
Figure 12. Heat consumption data in experimental room of November 12th, 2018 and January 11th, 2019.
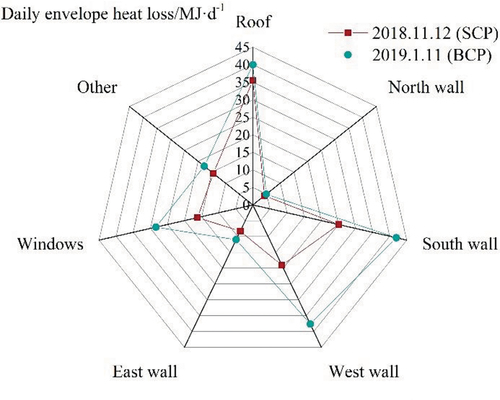
Figure 13. Sensible energy demands of zone with the change of ambient temperature
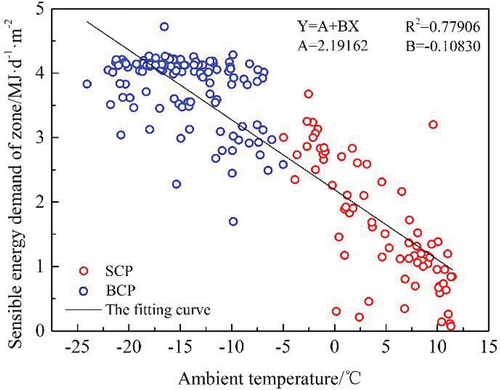
Figure 14. Photos and thermal imaging of different systems. (a) Photo of the room with coal-fire heating boiler. (b) Thermal imaging of the room with coal-fire heating boiler. (c) Photo of the room with the SAHP system. (d) Thermal imaging of the room with the SAHP system.
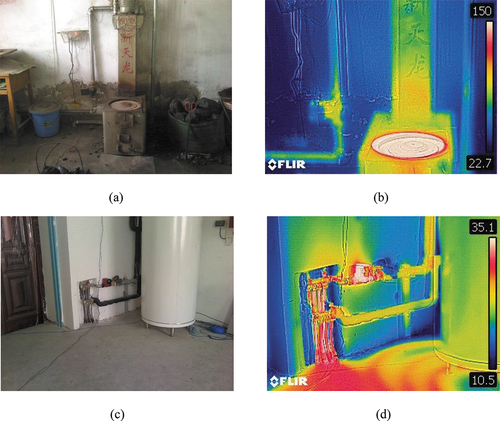
Figure 15. Indoor temperature and relative humidity in test room. (a) Heating by a coal-fired boiler. (b) Heating by the SAHP system.
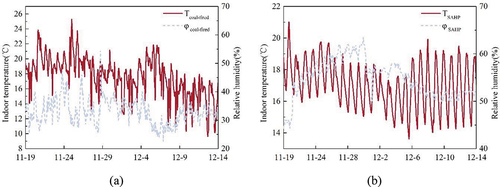
Figure 16. Schematic diagram of human thermal sensation
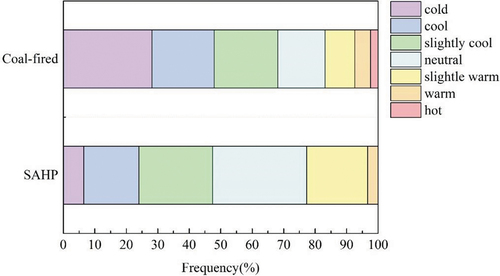
Figure 17. Consumption of standard coal with different months.
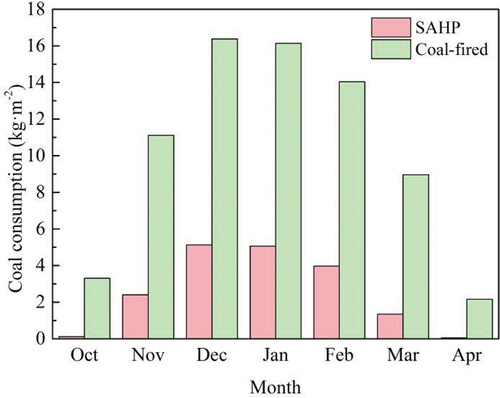
Table 2. Financial data the SAHP system.
Table 3. Comparison of SAHP heating and traditional coal-fired boiler heating.