
Figures & data
Figure 1. Conventional methods for high-rise building exterior cleaning.
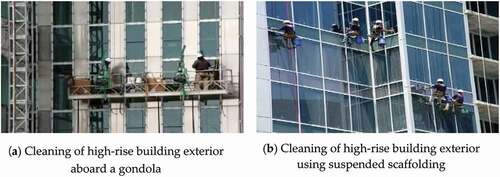
Figure 2. Representative disaster cases related to work on exterior walls suggested by KOSHA (Korea Occupational Safety & Health Agency Citation2019).
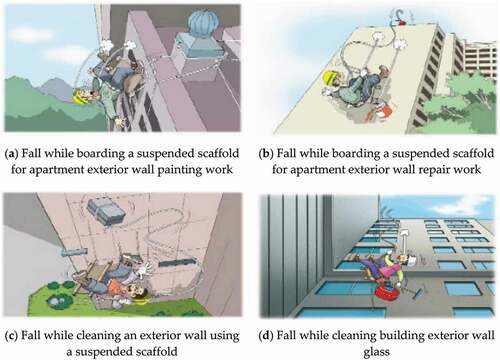
Table 1. Cleaning robots developed worldwide.
Figure 3. Components of the evaluated robot.
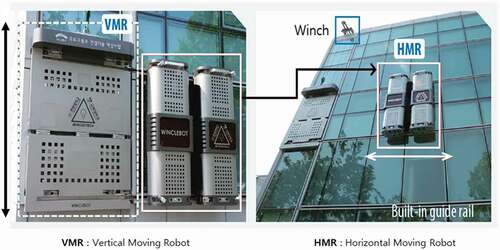
Figure 4. Components of the VMR (Han Citation2015).
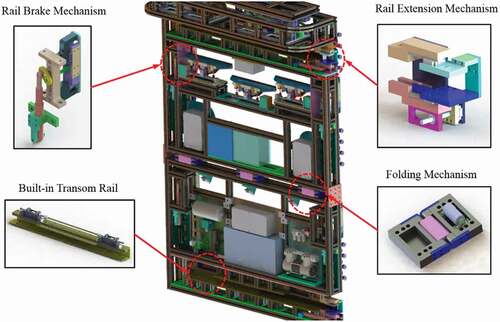
Figure 5. Components of the HMR (Han Citation2015).
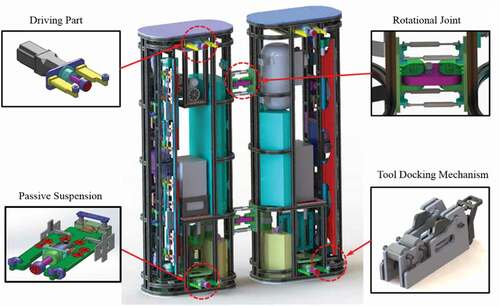
Figure 6. Driving performance of the HMR (Han Citation2015).
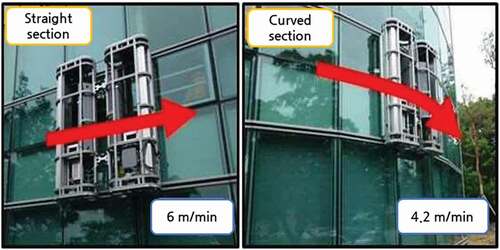
Figure 7. HHO of the HMR (Han Citation2015).
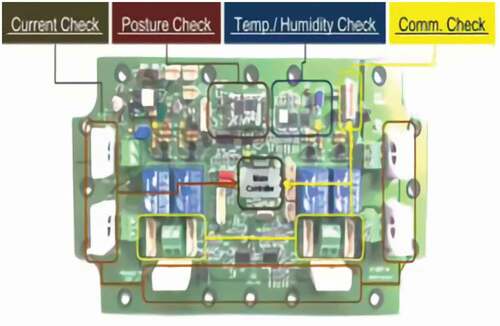
Figure 8. LC of the HMR (Han Citation2015).
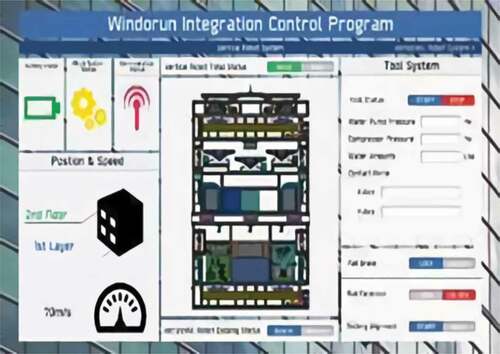
Figure 9. Automated operation of the robot.
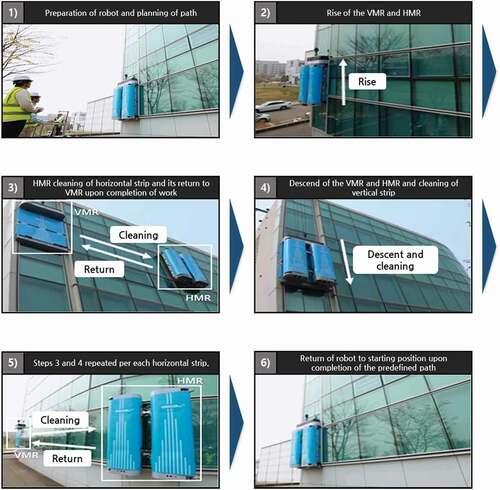
Table 2. Performance and specifications of the hardware of the developed robot.
Table 3. Costs of main components of a conventional curtain wall.
Table 4. Costs of main components of a curtain wall with guide rails.
Figure 10. LCC analysis model for the robot.
Table 5. Maintenance cost of the robot.
Table 6. Target building used in the LCC analysis.
Figure 11. Changes in financial data over the last 10 years.
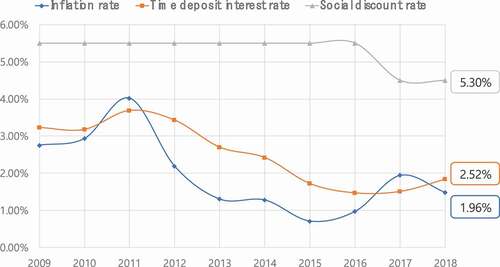
Figure 12. Cash flow diagram for the conventional and automated methods.
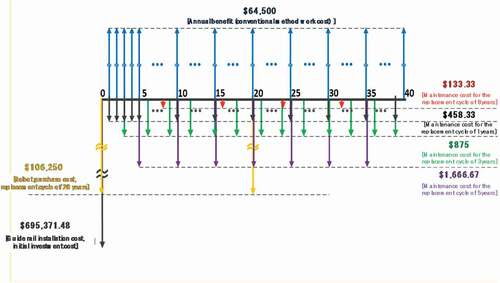
Figure 13. Rate of return analysis results.
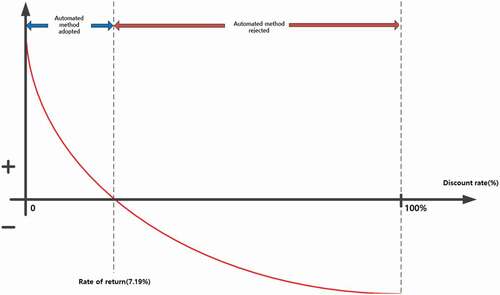
Figure 14. Breakeven point analysis results.
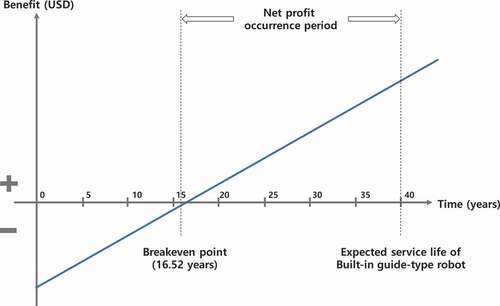
Figure 15. Cost reduction with the equivalent annual worth method.
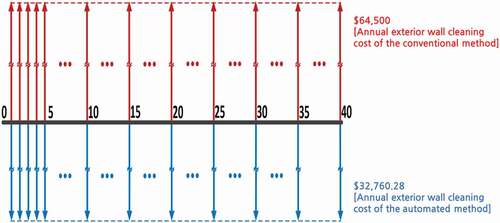
Table 7. Sensitivity analysis on the number of times cleaning is undertaken per year.
Table 8. Sensitivity analysis on the discount rate.
Table 9. Sensitivity analysis on the maintenance cost.
Table 10. Sensitivity analysis on the robot cost.
Table 11. Sensitivity analysis on the guide rail installation cost.