
Figures & data
Figure 1. Methodological flow.
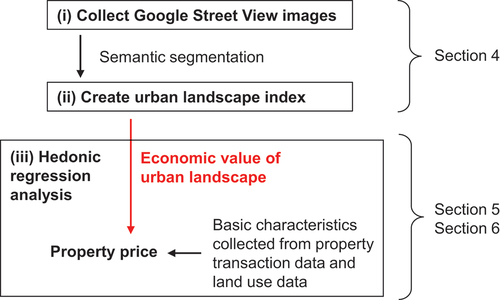
Table 1. Summary statistics.
Figure 2. Examples of original images and semantic segmentation.The right-hand squares show the pixel ratios of each landscape component within the images.
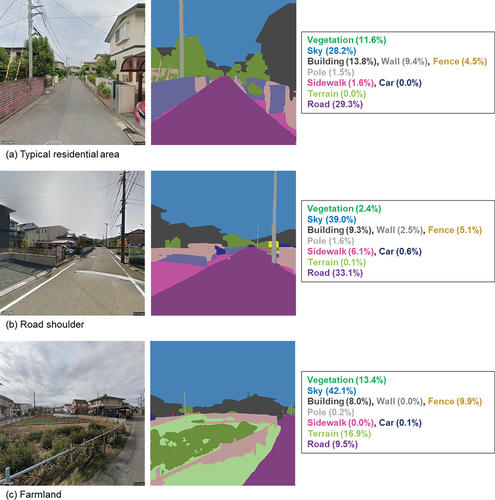
Figure 3. 12 views (every 30 degrees) for the typical residential areas shown in ).
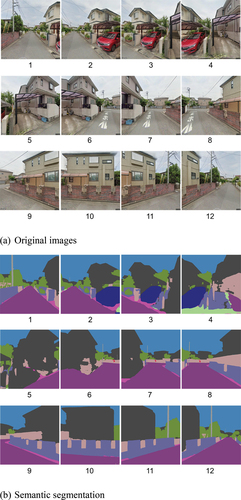
Table 2. Percentage of each landscape component for the 12 views of the typical residential areas shown in ).
Table 3. Hypotheses regarding correlations between the urban landscape index and property price.
Table 4. Correlations between urban landscape index and property price.
Table 5. Subsample analysis of land use type.
Table 6. Robustness checks.