Figures & data
Table 1. Summary of underground highway stations.
Figure 1. The characteristics of piston wind due to the train moving.
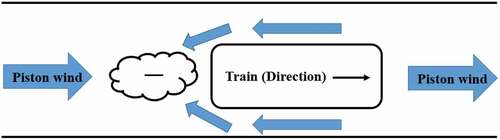
Figure 2. The configuration of the high-speed train.
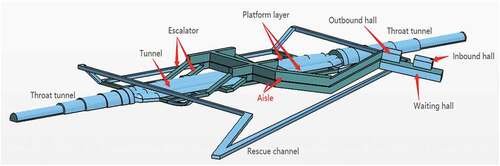
Figure 3. Geometry model of a typical underground highway station.
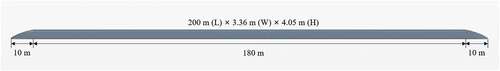
Figure 4. Measure points in the tunnel. (a) The locations of measure points in the transverse section; (b) the locations of measure points in the cross-section; (c) the locations of measure points in the inbound and outbound escalator; (d) the average wind velocity monitoring section.
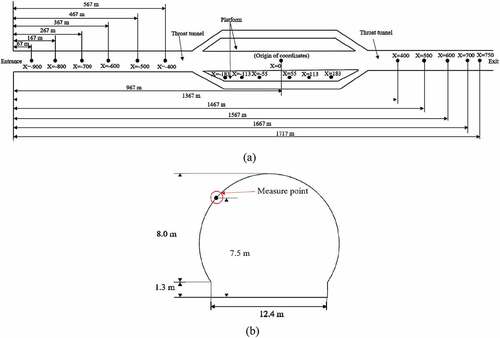
Figure 4. (Continued).
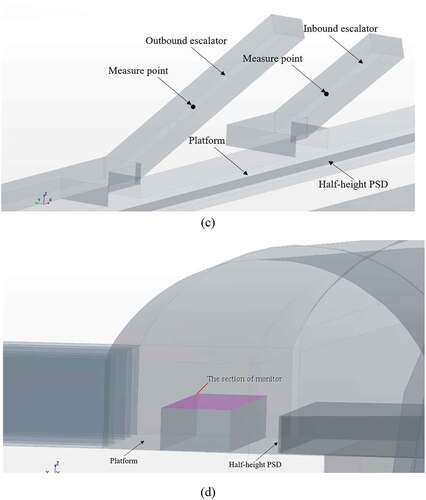
Figure 5. The size of the computation domain.
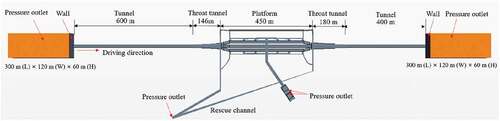
Figure 6. Computational grid. (a) Grids in the tunnel; (b) overset grid.
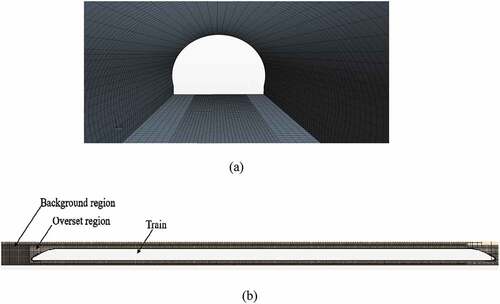
Figure 7. Schematic diagram of the experimental setup (Kim and Kim Citation2007).
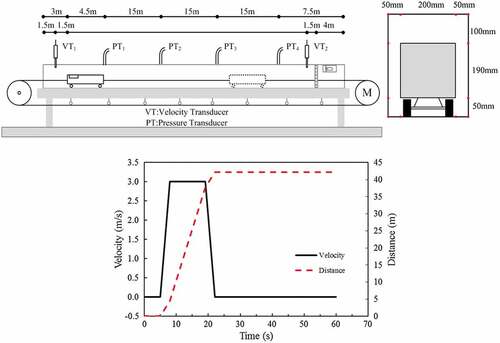
Figure 8. Comparisons of prison wind velocity and pressure between the calculated and experimental data (Kim and Kim Citation2007).
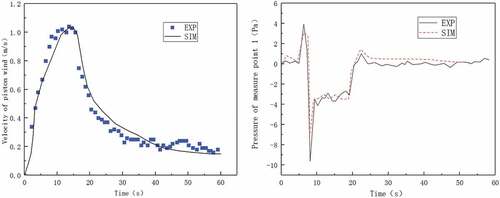
Table 2. Setting for grid independence analysis.
Figure 9. Grid Independence. Velocity of the measuring point in inbound escalator.
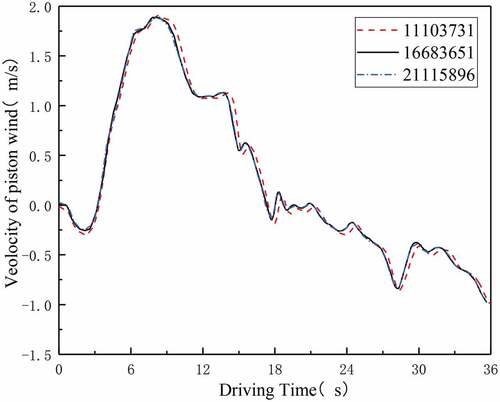
Figure 10. Pressure variations when the head and tail of the train begins to enter into the tunnel. (a) The head of the train enters into the entrance; (b) the tail of the train enters into the entrance.
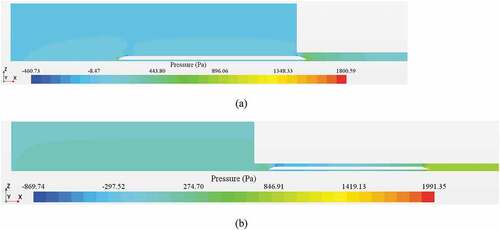
Figure 11. Pressure characteristics when the train is at three typical positons in the tunnel. (a) The head of the train is located at X = −468 m; (b) the head of the train is located at X = 91 m; (c) the head of the train is located at X = 1005 m.
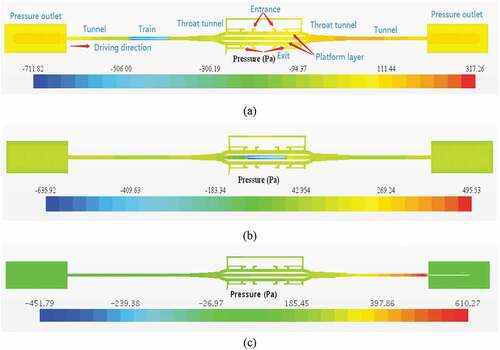
Figure 12. Pressure characteristics in the tunnel. (a) X = −900 m; (b) X = −800 m; (c) X = −700 m; (d) X = −600 m.
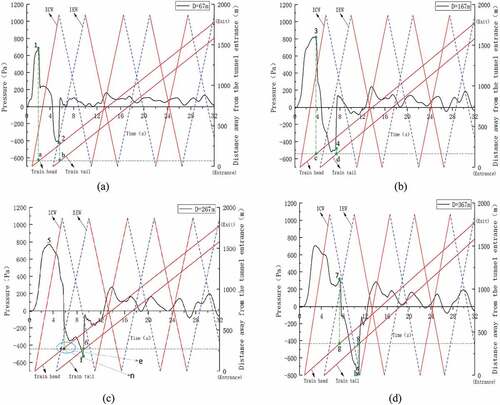
Figure 13. Airflow characteristics at X = −900 m, X = −800 m, X = −700 m, X = −600 m in the tunnel.
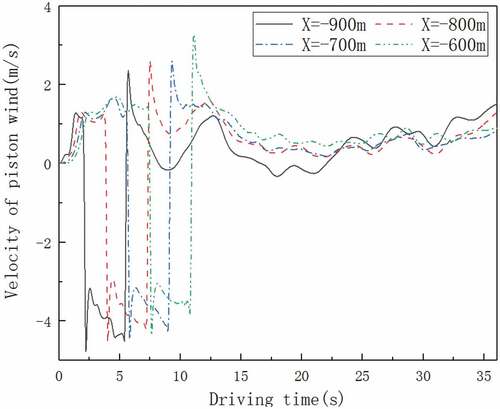
Figure 14. Pressure and air velocity peak value at different measure point. (a) Positive and negative pressure peak; (b) positive and negative velocity peak.
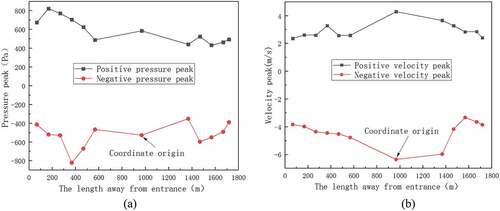
Figure 15. Pressures and airflow velocity characteristics in the tunnel at various train speeds. (a) Pressure contrast at X = −700 m; (b) velocity contrast at X = −700 m.
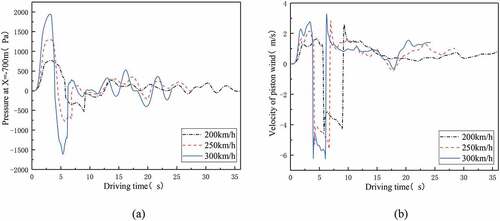
Figure 16. Airflow in the station with 200km/h train speed. (a) The head of the train is located at X= −468m;(b) the head of the train is located at X = 91 m; (c) the head of the train is located at X = 1005 m.
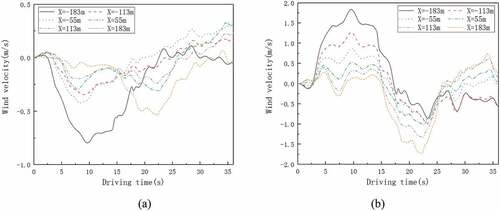
Figure 17. Wind velocities of various measure points on the platform. (a) vertical wind velocity; (b) horizontal wind velocity.
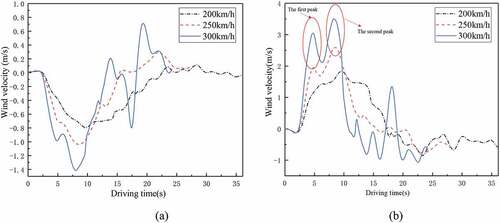
Figure 18. Wind velocities of X = −183 m on the platform at various train speeds. (a) vertical wind velocity; (b) horizontal wind velocity.
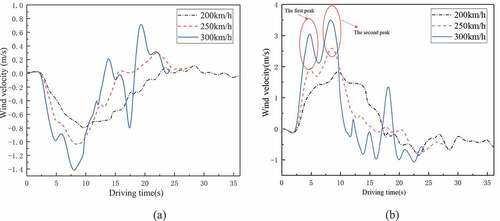
Figure 19. Average wind velocities of H = 1.7 m on the platform at various train speeds.
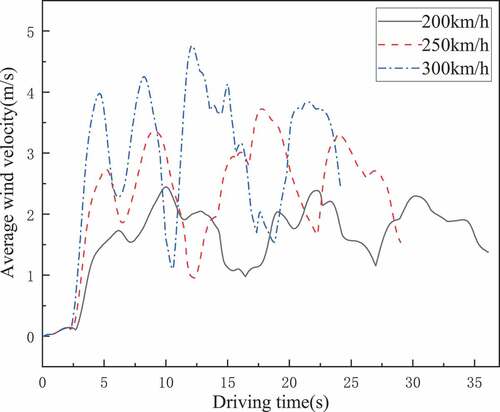
Figure 20. Pressure characteristics of measure point 1 on the platform at various train speeds.
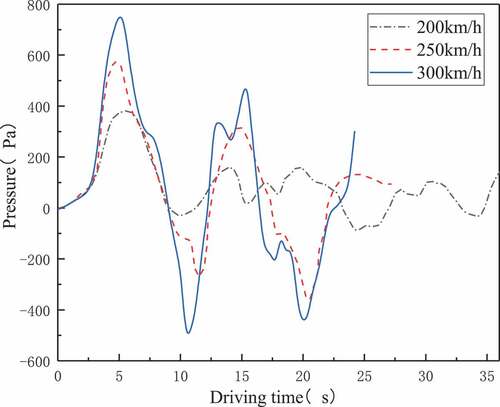
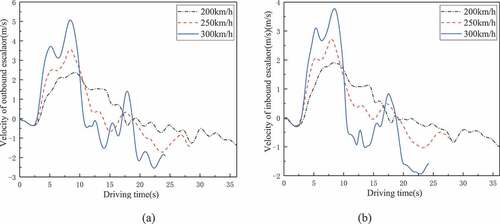
Figure 21. Velocities of outbound and inbound escalators at various train speeds. (a) Velocitiy contrast of outbound escalator; (b) velocitiy contrast of inbound escalator.