
Figures & data
Figure 1. Urban landscape including apartment complexes in Seoul.

Figure 2. Distribution of apartment complexes in Seoul.
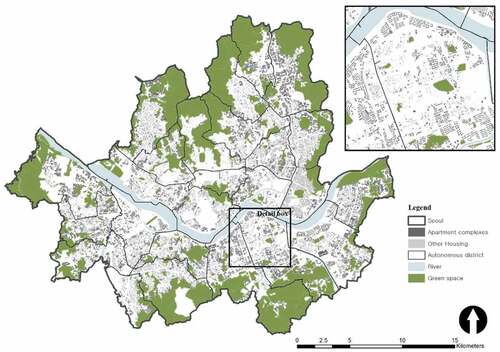
Table 1. Variable description and data source.
Table 2. Summary of statistics.
Figure 3. Apartment district ratio in Seoul, South Korea.
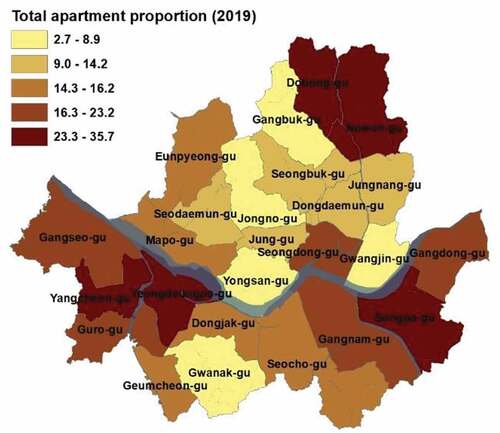
Figure 4. Apartment district ratio over 1000 households in Seoul, South Korea.
*gu means “autonomous district.”
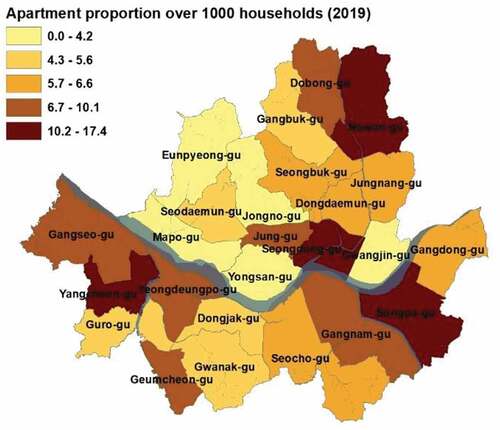
Table 3. Result for total apartment district ratio of each housing type.
Table 4. Result for apartment district ratio of middle and large scale.
Table A1. Result of robustness test for total apartment district ratio of each housing type.
Table B1. Result of robustness test for apartment district ratio of middle and large scale.