
Figures & data
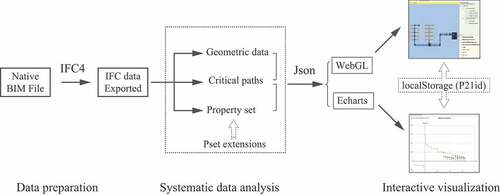
Figure 1. Schematic layout of a simple distribution system.
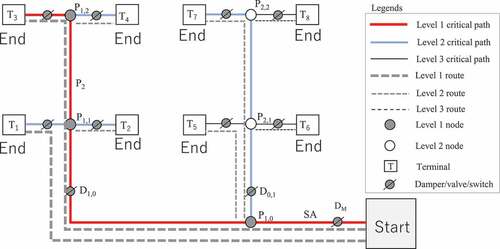
Table 1. Definition of the critical path class.
Figure 2. Schematic description of a system by the critical path class.
Figure 3. Example of connectivity relationships among duct elements.
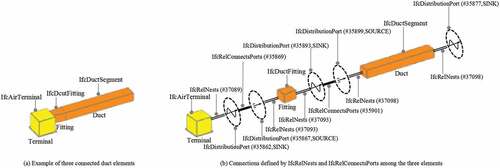
Figure 4. Definition of IfcRelAssignsToGroup.
Figure 5. Flow chart for searching the routes.
Figure 6. Flow chart for obtaining the critical path.

Figure 7. Flow chart for interactive visualization.
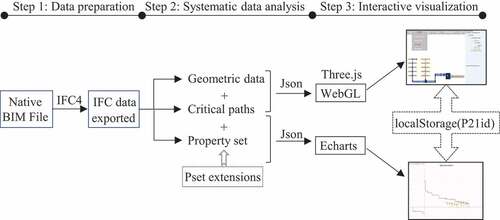
Figure 8. Ventilation system for case study and the interface of ifcPressureViewer.
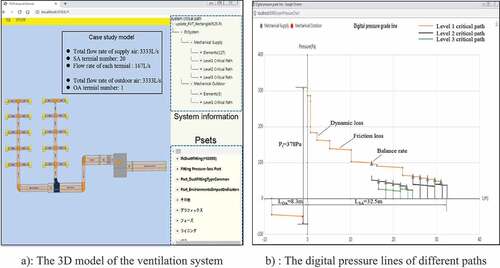
Figure 9. Example for adding the custom pressure loss.
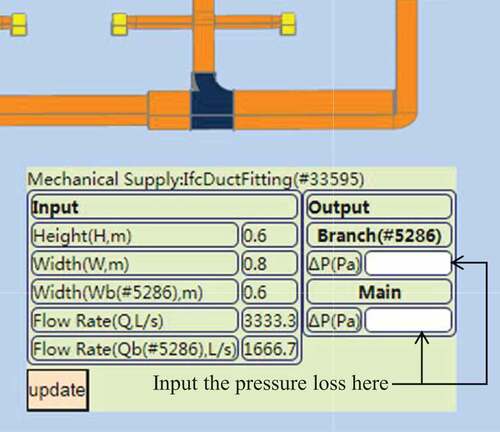
Figure 10. Pressure losses for selected critical paths.
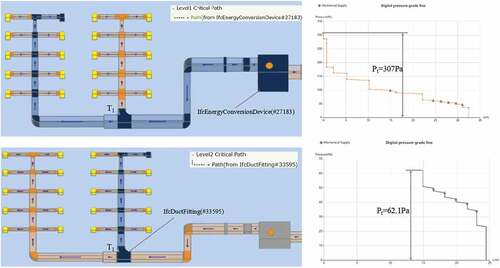
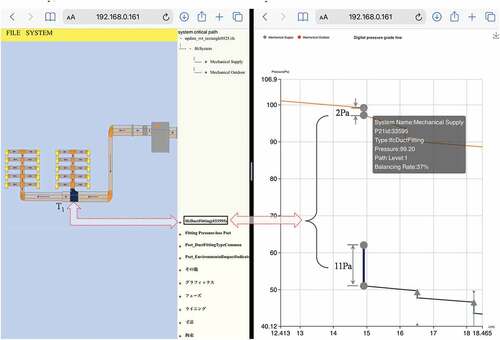
Figure 11. Interactive visualization between 3D model view and pressure chart.
Data availability statement
The data that support the findings of this study are available on request from the corresponding author, [L.X.]