Figures & data
Figure 1. (a) Coke drums in operation used in this study, and (b) Schematic diagram of the proposed monitoring system for vibration safety evaluation model.
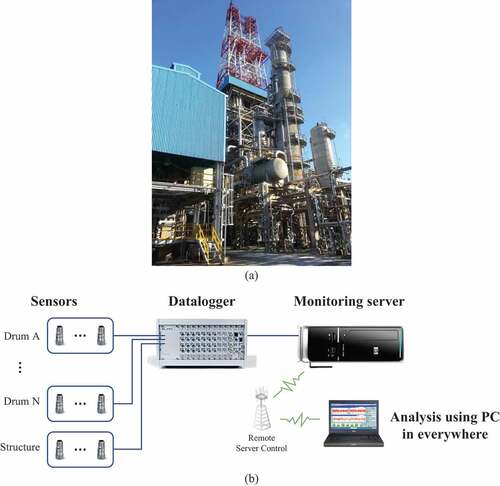
Figure 2. Vibration safety evaluation model for coke drums using the proposed monitoring system.
Figure 3. The main dimensions of the target coke drums.
Table 1. 1 Cyclical process of coke drums A and B.
Figure 4. Sensor installation locations and photographs.
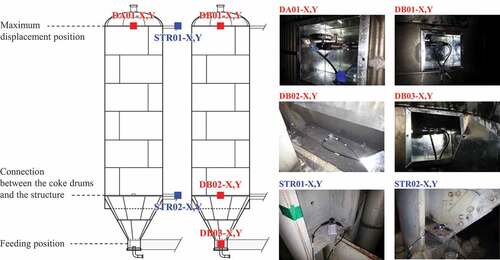
Table 2. Specifications of the measurement equipment used in this study.
Figure 5. Wiring diagram of the monitoring system; pictures of the control room, and monitoring screen.
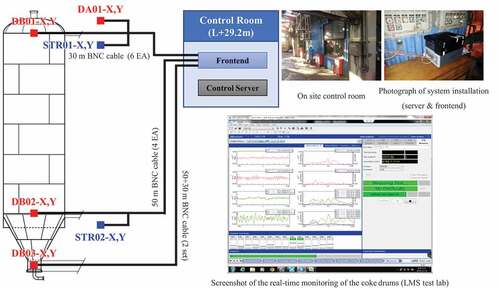
Figure 6. Upper displacement RMS of each coke drum for 20 cycles: (a) X-direction, (b) Y-direction.
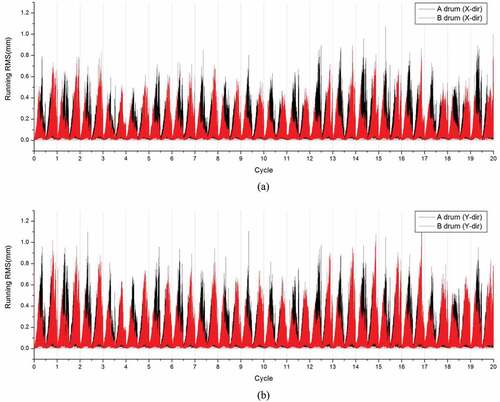
Figure 7. Upper Y-direction displacement RMS of each coke drum during one cycle: (a) coke drum A, (b) coke drum B.
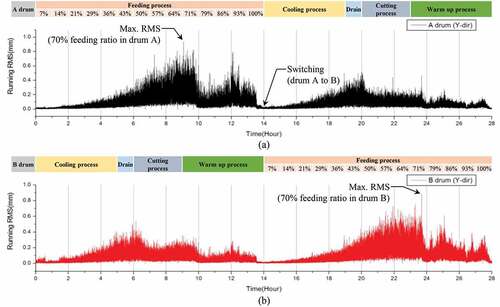
Table 3. Vibration safety evaluation according to screening criteria (5 mm/s) (when the feeding ratio was 70% in coke drum B).
Figure 8. Environmental influence variables: (a) local temperature, (b) average wind speed, (c) displacement RMS of coke drum A (upper, Y-direction).
Figure 9. The averaged spectrum graph of coke drums in the feeding process of drum A at one-hour intervals.
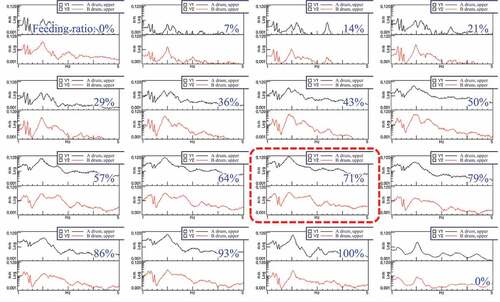
Figure 10. The FE model of coke drums.
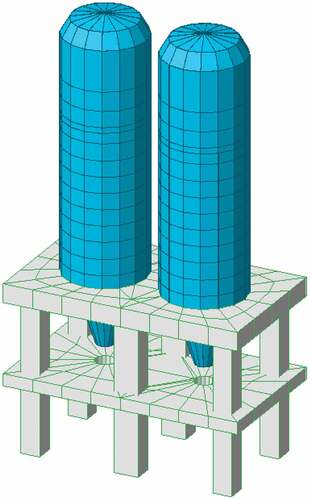
Table 4. Comparison of the mode frequencies extracted from the experimental data and the mode frequencies calculated by FE model in 14% feeding process.
Table 5. The change in each mode frequency according to the increase in the feeding ratio.
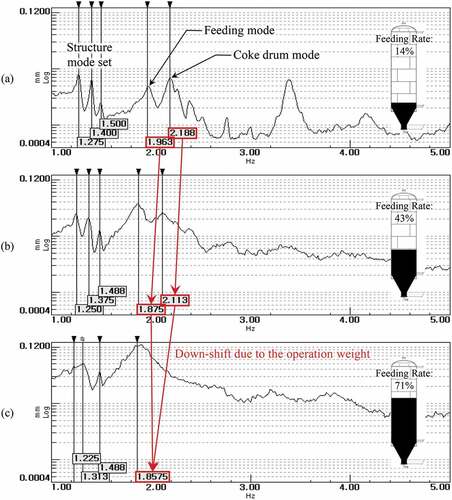
Figure 11. Averaged spectrum graph of coke drum A and changes in structure, feeding, and coke drum mode: feeding ratio (a) 14%, (b) 43%, (c) 71%.