
Figures & data
Figure 1. The geographical location of Nanchang and research area.
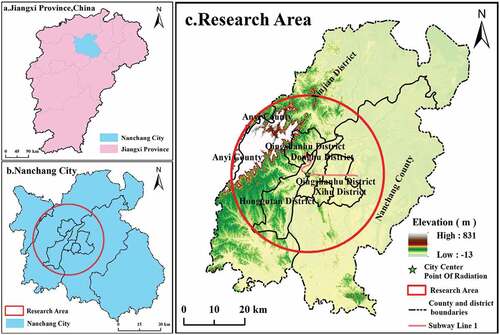
Figure 2. Workflow in this study.
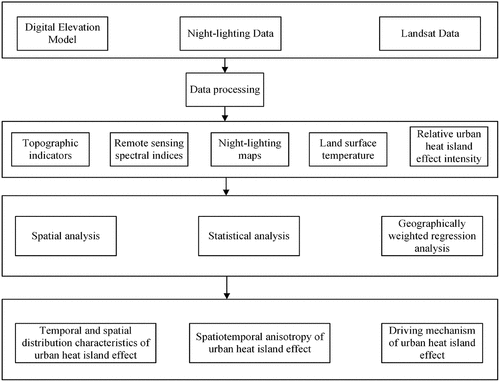
Figure 3. Spatiotemporal distribution characteristics of the UHI effect in Nanchang city: (a)-(c) 2000, 2010, and 2019, respectively.
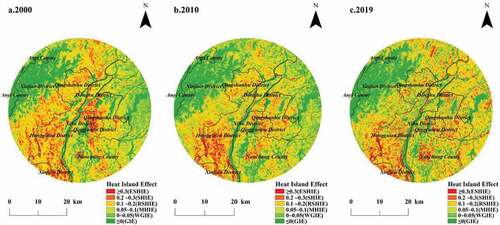
Table 1. Impact indexes of the UHI effect in Nanchang city.
Table 2. Classification of the UHI effect.
Figure 4. Profile map of the UHIEI in Nanchang city with 2000, 2010, and 2019: (a), (b), (c), and (d), respectively.
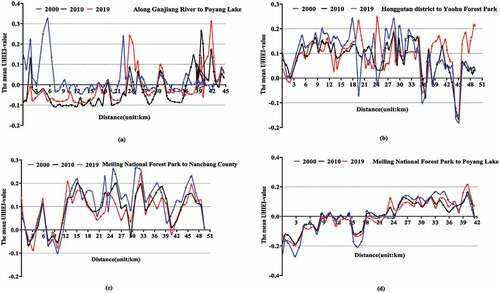
Table 3. Statistics on the UHI effect of Nanchang in 2000, 2010 and 2019.
Table 4. The OLS model regression results and diagnostics for 2000, 2010, and 2019.
Table 5. Results and diagnostics of the GWR analysis in 2000, 2010, and 2019.
Figure 5. Spatial distribution of the local R2 in GWR Model of Nanchang City: (a)-(c) 2000, 2010, and 2019, respectively.
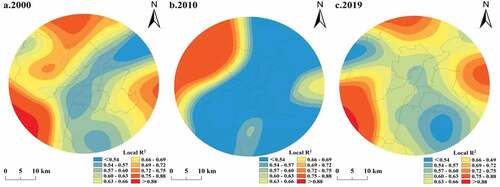
Figure 6. Regression coefficient of topography and vegetation factors in GWR models: (a)-(c) 2000, 2010, and 2019, respectively.
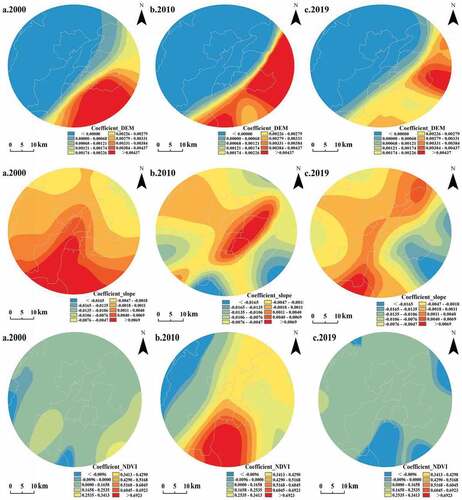
Figure 7. Regression coefficient of buildings, bare land, and social-economic factors in GWR Models: (a)-(c) 2000, 2010, and 2019, respectively.
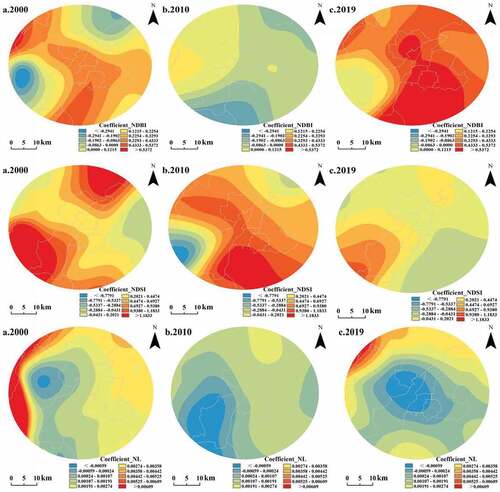
Table 6. Descriptive statistics of regression coefficients of GWR models for 2000, 2010, and 2019.