
Figures & data
Figure 1. Research flow chart.
Figure 2. Location of the study area.
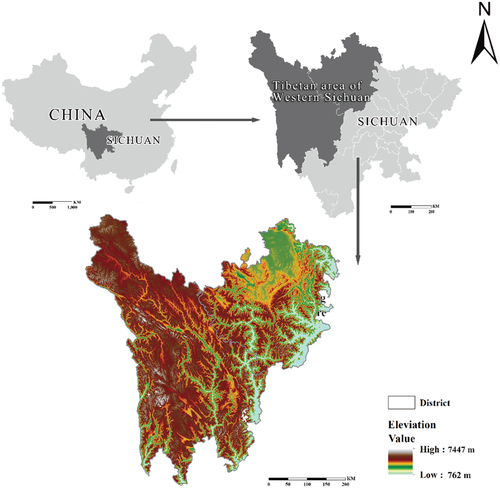
Figure 3. Photos of the test subjects.
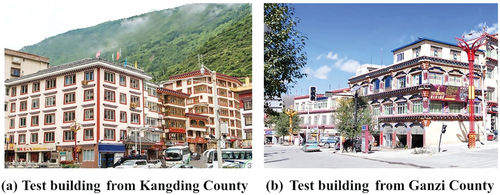
Table 1. Basic technical parameters of the measurement equipment.
Figure 4. Simulated and measured temperatures of north-facing rooms.
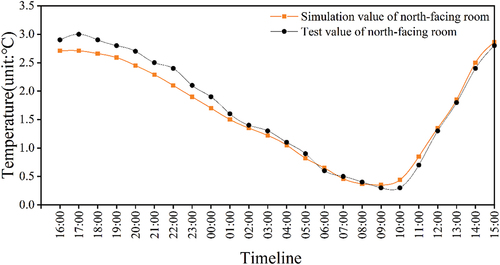
Figure 5. Simulated and measured temperatures of south-facing rooms.
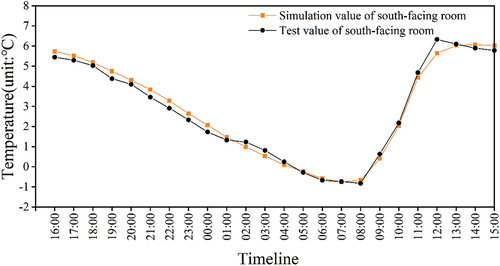
Table 2. Basic parameters of typical low-energy dwellings in the Tibetan areas of western Sichuan.
Figure 6. Building model.
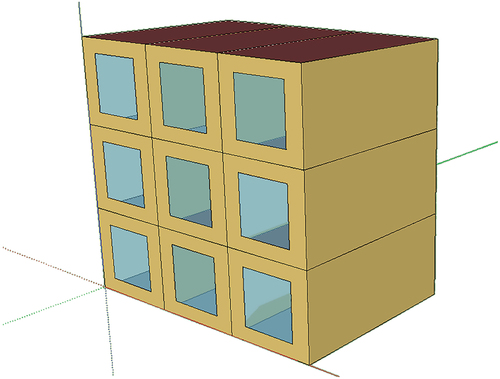
Table 3. Thermal parameters of doors and windows.
Table 4. ANOVA table for the TOMTD regression model.
Figure 7. Relationship between the mean indoor temperature and solar radiation and orientation. SR represents the solar radiation settings, and the radiation intensity gradually increased from SR-1 to SR-19.
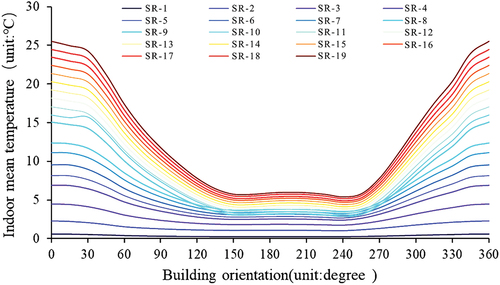
Table 5. Linear relationships between the average indoor temperature and the southern wall area-to-ground area ratio, latitude, and average outdoor temperature.
Figure 8. The correlations between the southern wall area-to-ground area ratio, the building shape coefficient and the average indoor temperature.
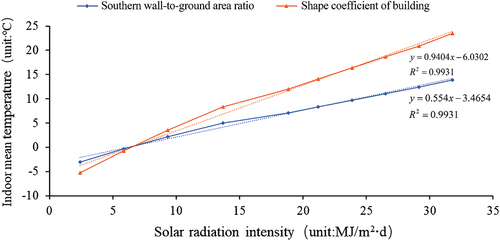
Table 6. ANOVA table for the MITD regression model.
Figure 9. Linear relationship between the building width and average indoor temperature. The solar radiation intensity gradually increases from SR-5 to SR-19.
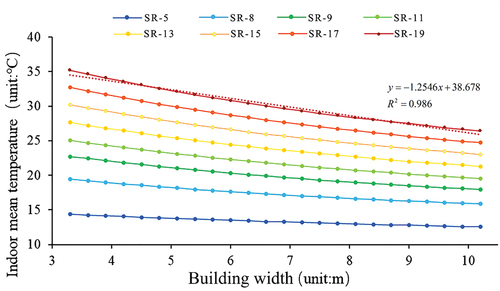
Table 7. Optimal orientations and suitable orientations of major cities in the Tibetan areas of western Sichuan.
Table 8. Optimal residential building shape designs in major cities in the Tibetan areas of western Sichuan.