
Figures & data
Figure 1. Methodology.
Figure 2. Modeling concept of risk management (Kim Citation2020).
Figure 3. The models of apartment development projects (Kim Citation2020).
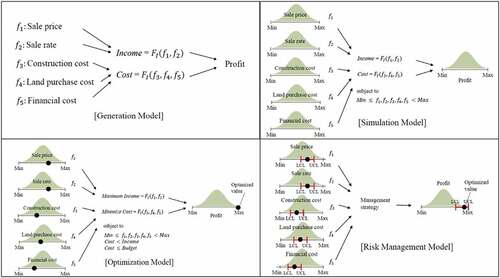
Figure 4. Simulation phase of economic feasibility (Lee et al. Citation2019).
Figure 5. Causal-loop diagram (Lee et al. Citation2019).
Figure 6. Income, cost, financial cost, and project profit model.
Figure 7. Integrated simulation model.
Figure 8. Fluctuation of apartment house prices in Korea: (a) Apartment house prices vs. Per capita national income. (b) Apartment house price cycle.
Figure 9. Risk range limit cases of the unit sales price.
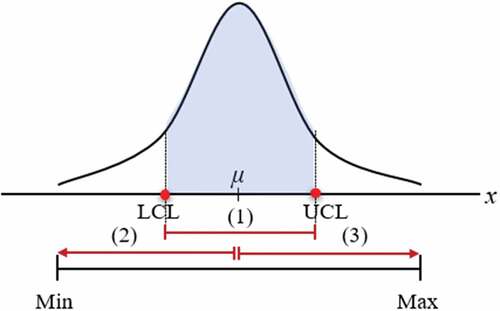
Table 1. Overview of the apartment case project.
Figure 10. Random variable generation by risk factors and project profit.
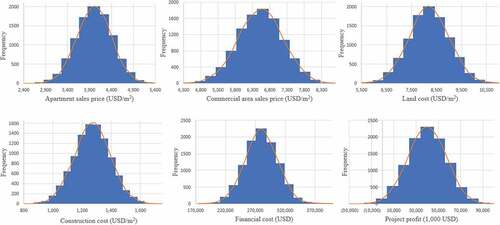
Table 2. Result of forecasting simulation.
Figure 11. Setting risk range limit to risk factors and project profit.
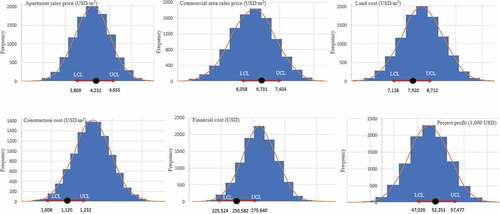
Table 3. Setting risk range limit to risk factors at initial stage review (t0).
Table 4. Risk range limit to risk factors after land cost is fixed (t1).
Table 5. Risk range limit to risk factors after construction cost is fixed (t2).