
Figures & data
Figure 1. Hammer failure of precast pile: (a) pile top burst and (b) post-burst pile.
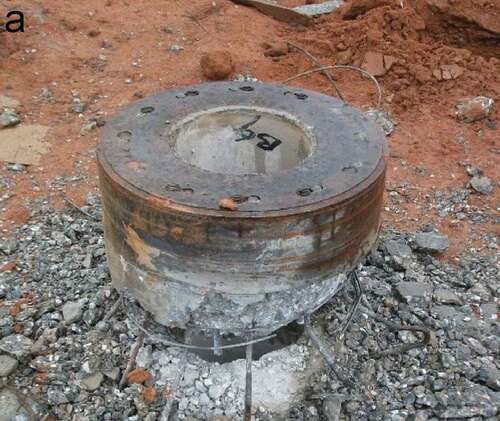
Figure 2. Coarse aggregate used in the experiment: (a) lean iron ore coarse aggregate and (b) limestone coarse aggregate.
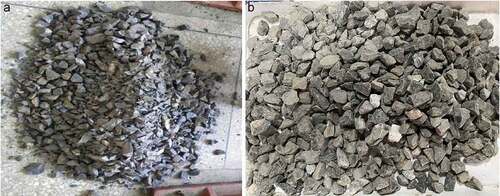
Figure 3. Gradation curve of aggregate.
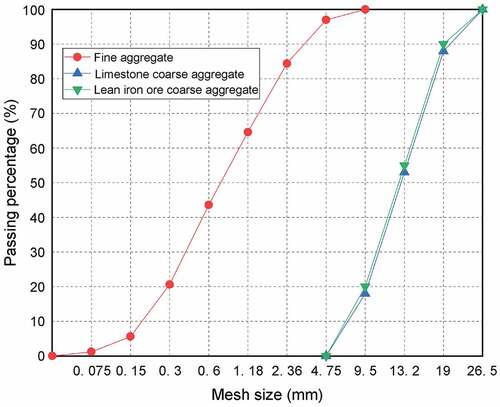
Table 1. Physical and mechanical properties of various coarse aggregates.
Table 2. Statistical distribution of harmful chemicals and iron content in lean iron ore.
Table 3. Preliminary mix proportions.
Table 4. Compressive strengths of mixes.
Figure 4. Self-made drop hammer impact test device.
Figure 5. Initial cracking of lean iron ore concrete: (a) A1, (b)A2, (c) A3, and (d) A4.
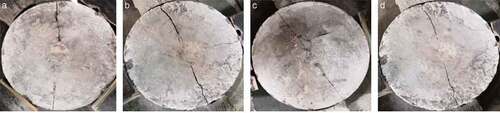
Figure 6. Initial cracking of benchmark concrete: (a) B1,(b) B2, (c) B3, and (d) B4.
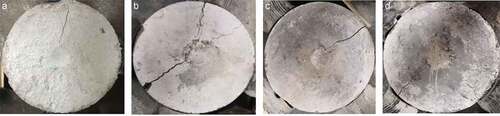
Figure 7. Final cracking of lean iron ore concrete: (a) A1, (b) A2, (c) A3, and (d) A4.
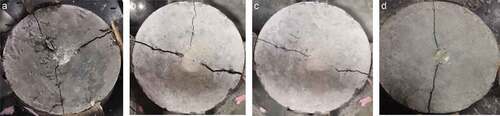
Figure 8. Final cracking of benchmark concrete: (a)B1, (b) B2, (c) B3, and (d) B4.
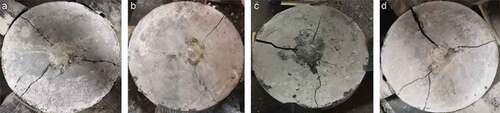
Table 5. Surface fracture ratio of coarse aggregate to hardened cement paste.
Figure 9. C80 lean iron ore concrete (A3) section.
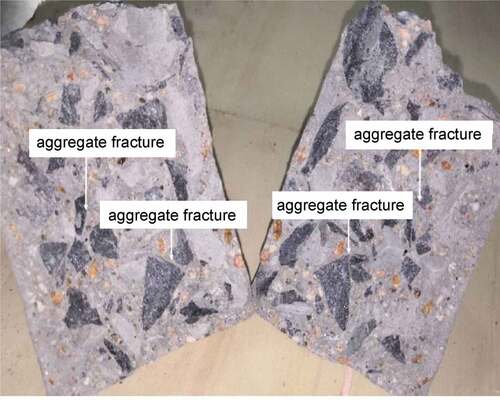
Figure 10. C60 lean iron ore concrete (A1) section.
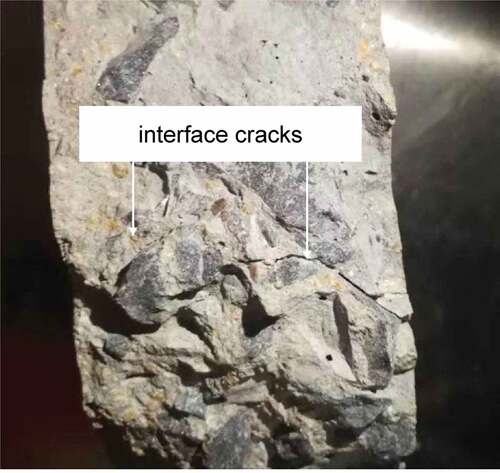
Figure 11. C70 benchmark concrete (B2) section.
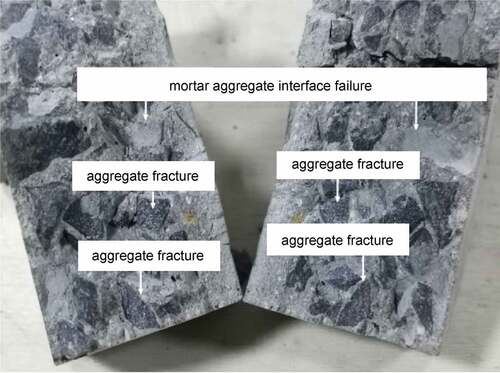
Table 6. Test results for each mix.
Table 7. Average results of impact test indexes.
Figure 12. Linear regression results for number of impacts N1 at initial cracking: (a) A1, (b) A2, (c) A3, and (d) A4.
Figure 13. Linear regression results for number of impacts N2 at final cracking: (a) A1, (b) A2, (c) A3, and (d) A4.
Table 8. Weibull fitting results.
Figure 14. Relationship between strength grade and number of impacts.
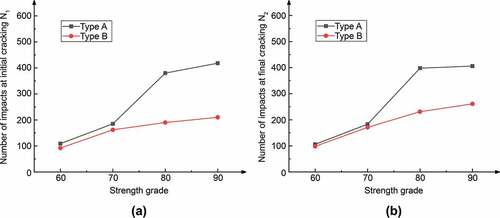
Figure 15. Relationship between strength grade and fracture energy.
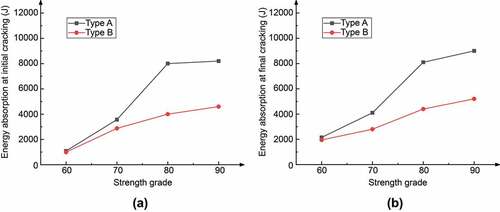
Figure 16. Relationship between strength grade and number of impacts between initial and final cracking.
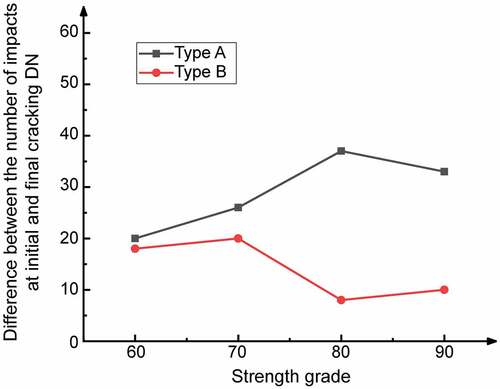
Table 9. Ductility index.
Figure 17. Relationship between impact resistance and strength grade according to different concrete mix types (conventional and lean iron ore mix).
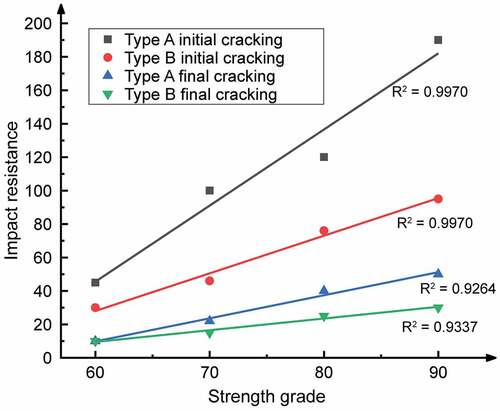
Figure 18. Relationship between fracture energy and fitted values according to strength grade.
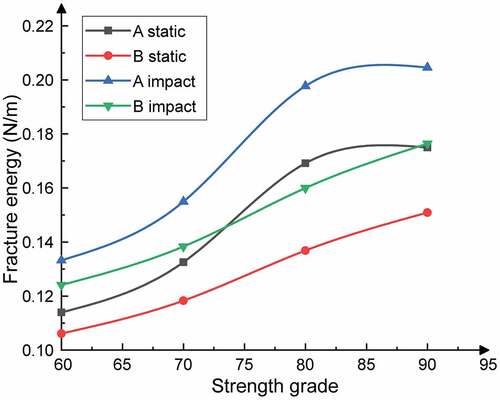
Figure 19. Construction soil survey data.
Table 10. Construction records.
Table 11. Lifespan extension of precast lean iron ore concrete piles under harsh geological conditions.