
Figures & data
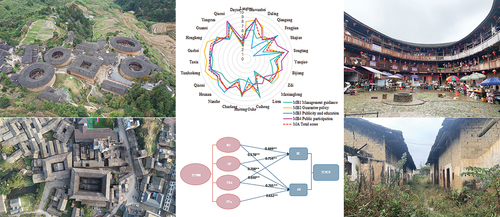
Figure 1. Geographic distribution of the villages studied.
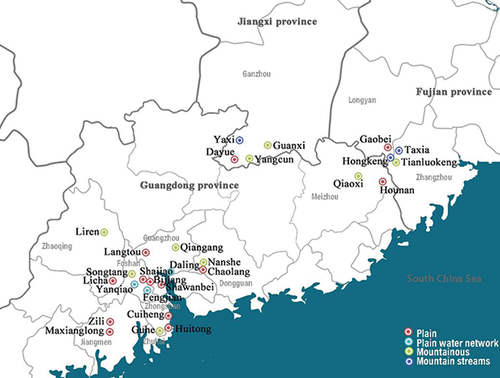
Figure 2. A. Aerial view of Qiangang (50% of traditional buildings have collapsed). b. Aerial view of Nanshe (traditional buildings are well protected and utilized). c. Aerial view of Tianluokeng (traditional buildings are well protected and utilized). d. Aerial view of Taxia (traditional buildings were all protected and utilized). e. Aerial view of Yaxi (traditional buildings are well protected and utilized). f. Aerial view of Yangcun (some traditional buildings are in danger of collapse).
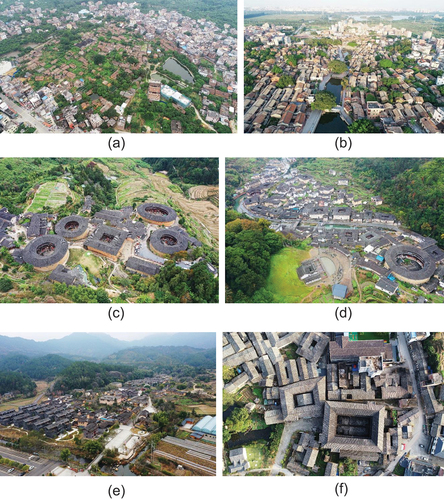
Table 1. Overview of the sample villages.
Table 2. TCVMM evaluation system.
Table 3. TCVCU evaluation system.
Figure 3. (a). All 27 villages’ TCVMM evaluation scores. (b). All 27 villages’ TCVCU evaluation scores.
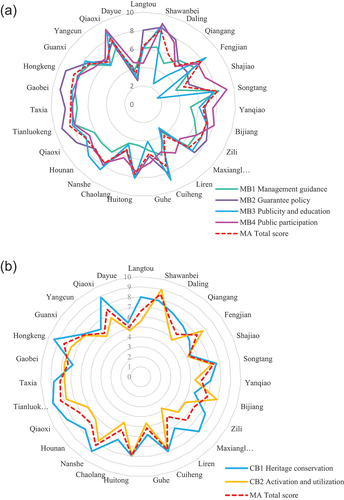
Figure 4. Evaluation scores of the 27 villages on management guidance factors.
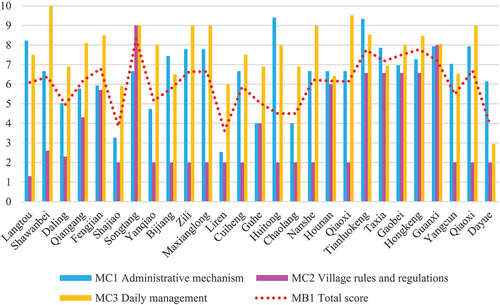
Figure 5. Evaluation scores of the 27 villages on guarantee policy factors.
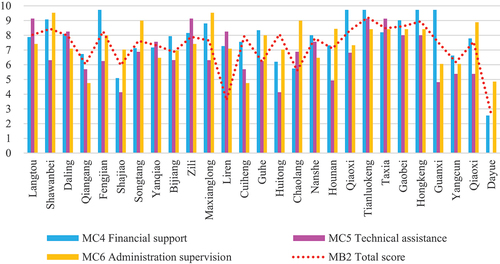
Figure 6. Evaluation scores of the 27 villages on publicity and education factors.
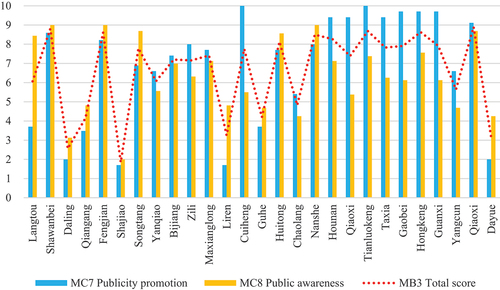
Figure 7. Evaluation scores of the 27 villages on public participation factors.
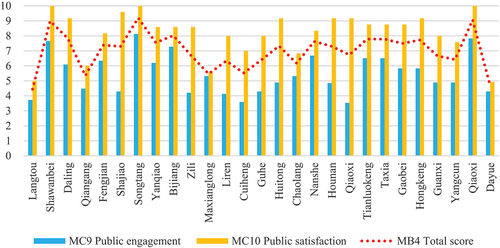
Figure 8. Correlation analysis of TCVMM and TCVCU.
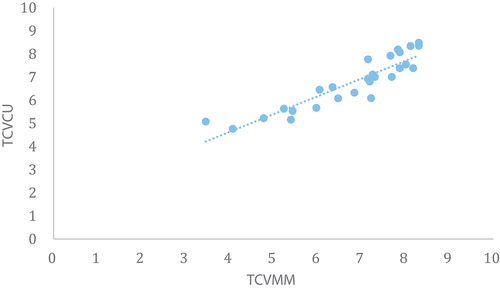
Table 4. Linear regression analysis (n = 27).
Table 5. Correlation coefficients between the MC and CC layers.
Figure 9. Correlations of the first-level factors between TCVMM and TCVCU.
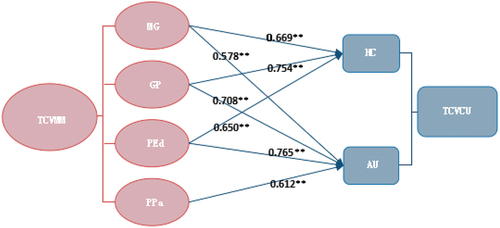
Table 6. Correlation coefficients between the MD and CD layers.
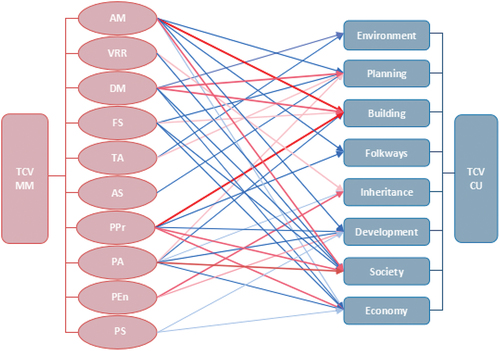
Figure 10. Correlations of the second-level factors between TCVMM and TCVCU.
Data Availability Statement
Not applicable.