Figures & data
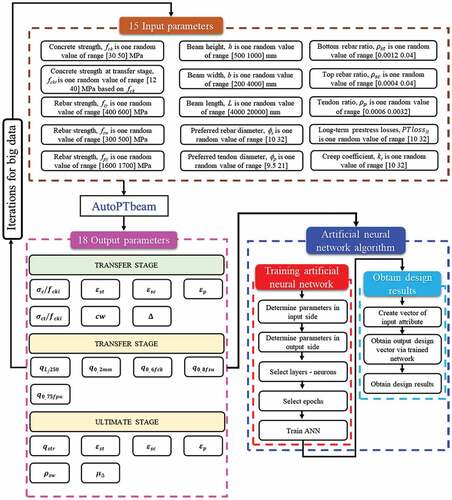
Figure 1. Bonded pre-tensioned beams with pin-pin ends for an AI-based design.
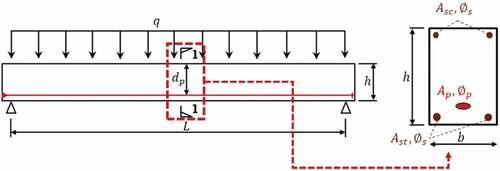
Table 1. Fifteen input parameters to generate big datasets using AutoPTbeam for pre-tensioned beams.
Figure 2. Three load stages of PT beams.
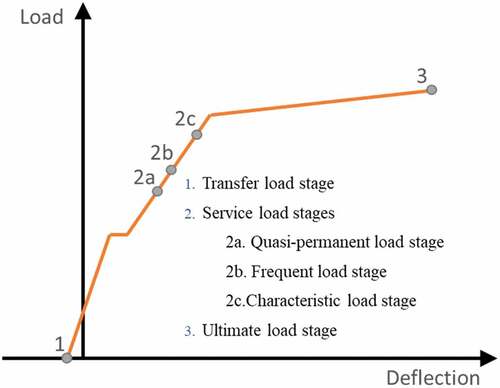
Table 2. 18 output of forward designs of a PT beam.
Figure 3. Histogram of 15 inputs based on 50.000 data.
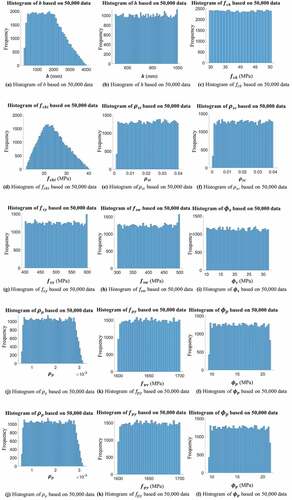
Figure 4. Histogram of seven outputs of a transfer stage based on 50.000 data.
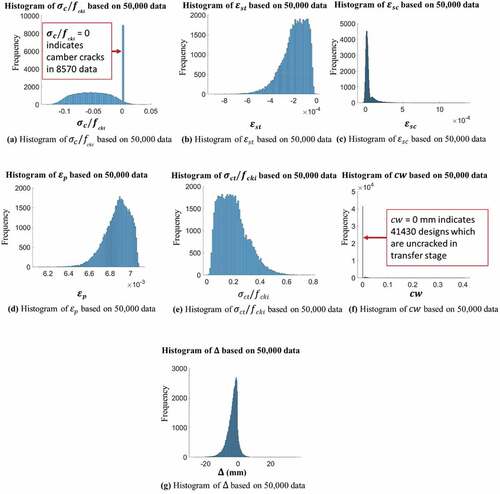
Figure 5. Histogram of five outputs of a service stage based on 50.000 data.
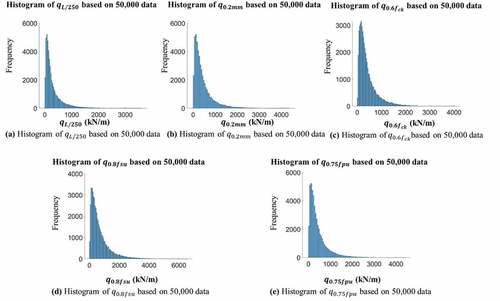
Figure 6. Histogram of six outputs of an ultimate stage based on 50.000 data (a) Algorithm for designing bonded pre-tensioned beams (AutoPTbeam) (b) Generation of large datasets.
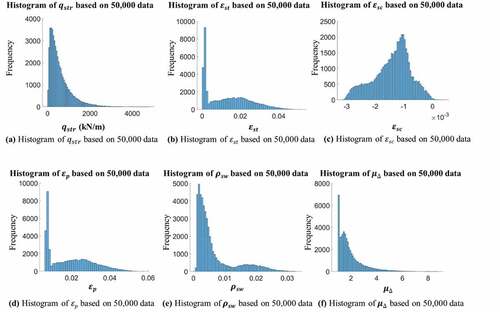
Figure 7. Generation of large datasets of bonded pre-tensioned beams for AI-based design (Nguyen and Hong Citation2021)
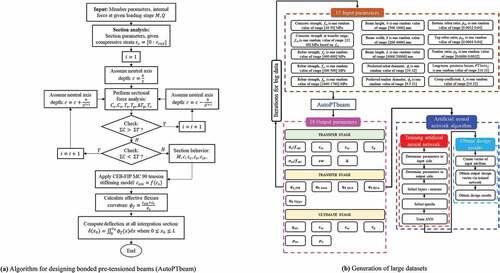
Table 3. List of random variables and corresponding ranges of the big structural datasets.
Table
Figure 8. Design scenarios; one forward and one reverse designs.
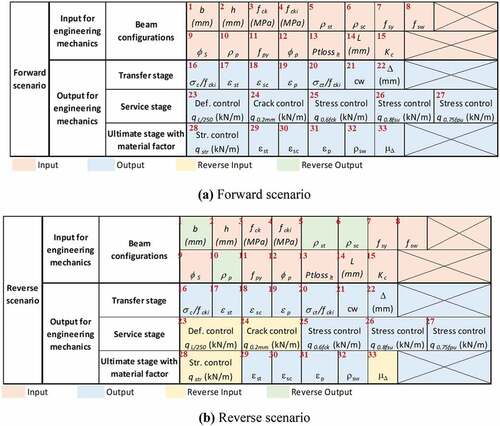
Figure 9. Design accuracies; tendon ratio of 0.001 based on PTM.
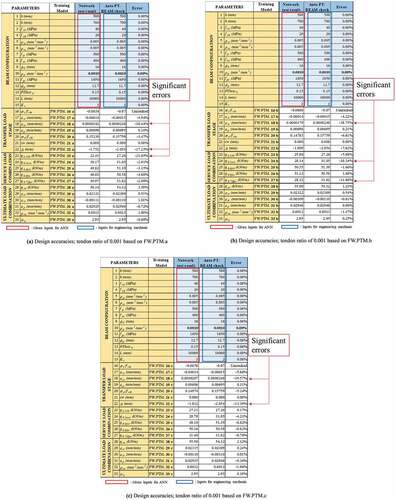
Figure 10. Design accuracies; tendon ratio of 0.002 based on PTM.
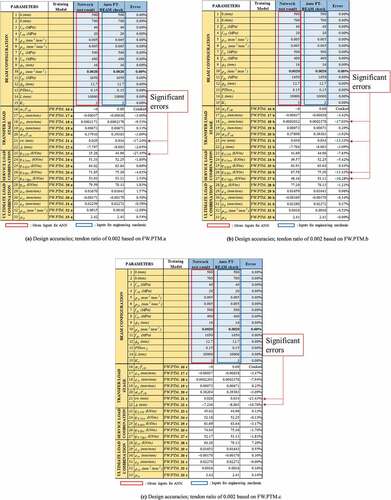
Table 4. Training summary based on PTM for a forward design.
Figure 11. Design charts corresponding to ρp.
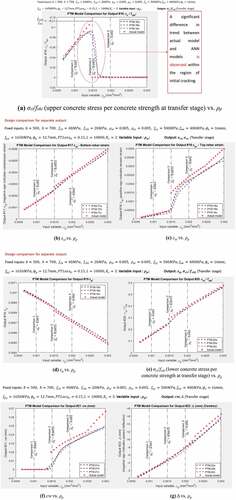
Figure 12. Design results based on 20 layers-20 neurons for Step 1;qL/250 = 80 kN/m at SLL (at a deflection of L/250), qstr = 150 kN/m at ULL, and deflection ductility ratios (μΔ) of 1.50 at ULL.
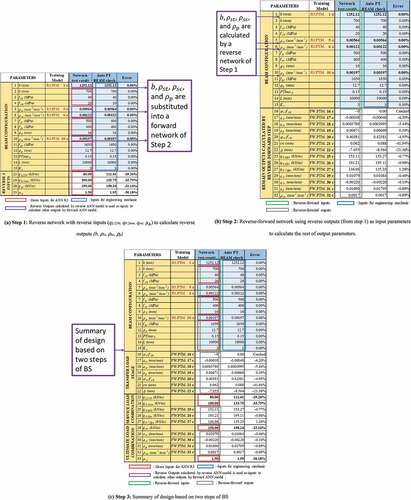
Table 5. Training accuracies of a reverse scenario based on PTM; reverse network of Step 1.
Figure 13. Design results based on 20 layers-20 neurons for Step 1; qL/250 = 80 kN/m at SLL (at a deflection of L/250), qstr = 150 kN/m at ULL, and deflection ductility ratio (μΔ) of 1.50 adjusted to 1.95 at ULL.
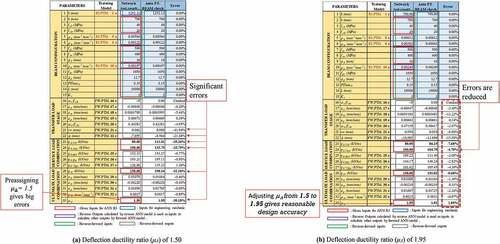
Figure 14. Design results based on 20 layers-20 neurons for Step 1; qL/250 = 80 kN/m at SLL (at a deflection of L/250), qstr = 150 kN/m at ULL, and deflection ductility ratio (μΔ) of 2.00 and 2.50 at an ultimate load limit state (ULL).
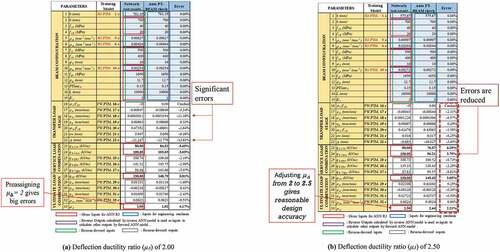
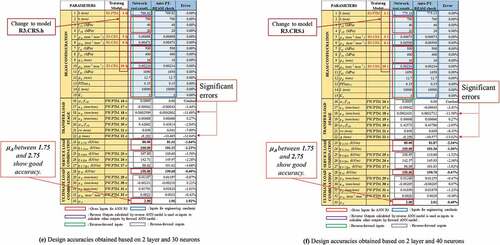
Figure 15. Design results 30 layers-30 neurons for Step 1 neurons for Step 1; qL/250 = 80 kN/m at SLL (at a deflection of L/250), qstr = 150 kN/m at ULL, deflection ductility ratio (μΔ) of 2.00 and 2.50 at an ultimate load limit state (ULL).
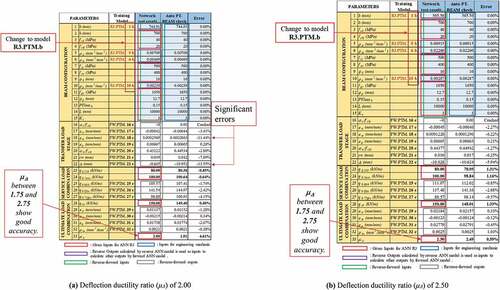
Figure 16. Design results 40 layers-40 neurons for Step 1 neurons for Step 1; qL/250 = 80 kN/m at SLL (at a deflection of L/250), qstr = 150 kN/m at ULL, deflection ductility ratio (μΔ) of 2.00 and 2.50 at an ultimate load limit state (ULL).
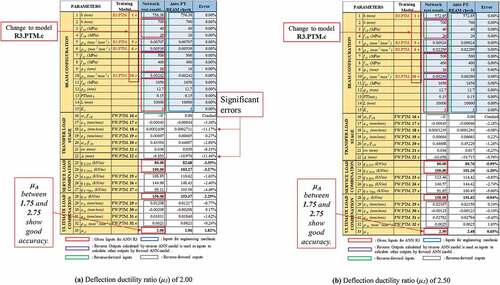
Table 6. Training sequence of a reverse scenario based on CRS (DNN).
Figure 17. Design accuracies of a reverse scenario based on CRS (DNN); qL/250 = 80 kN/m at SLL (at a deflection of L/250), qstr = 150 kN/m at ULL, deflection ductility ratio (μΔ) of 2.00 at ULL; 20 layers-20 neurons for Step 1.
Figure 18. Design accuracies of a reverse scenario based on CRS (DNN); qL/250 = 80 kN/m at SLL (at a deflection of L/250), qstr = 150 kN/m at ULL, deflection ductility ratio (μΔ) of 1.50 adjusted to 1.75 at ULL; 20 layers-20 neurons for Step 1.
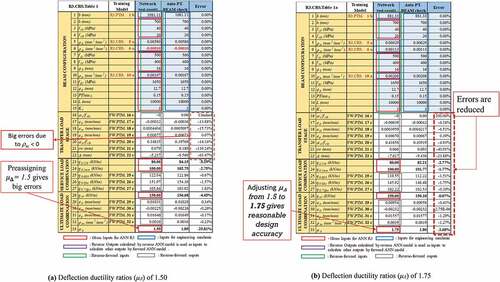
Figure 19. Design accuracies of a reverse scenario based on CRS (DNN); qL/250 = 80 kN/m at a deflection of L/250 at SLL, qstr = 150 kN/m at ULL, and deflection ductility ratios (μΔ) of 2.00, 2.50 at ULL; 20 layers-20 neurons for Step 1.
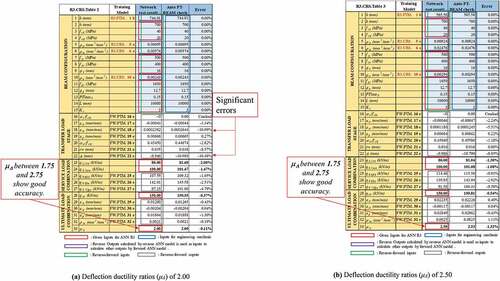
Figure 20. Design accuracies of a reverse scenario based on CRS (DNN); qL/250 = 80 kN/m at a deflection of L/250 at SLL, qstr = 150 kN/m at ULL, and deflection ductility ratios (μΔ) of 2.00, 2.50 at ULL; 30 layers-30 neurons for Step 1.
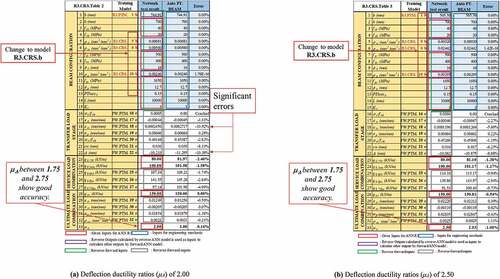
Figure 21. Design accuracies of a reverse scenario based on CRS (DNN); qL/250, 80 kN/m at a deflection of L/250 at SLL, qstr 150 kN/m at ULL, and deflection ductility ratios (μΔ) of 2.00, 2.50 at ULL; 40 layers-40 neurons for Step 1.
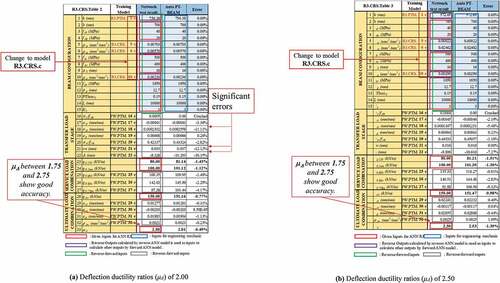
Figure 22. Reciprocal design charts, errors indicated.
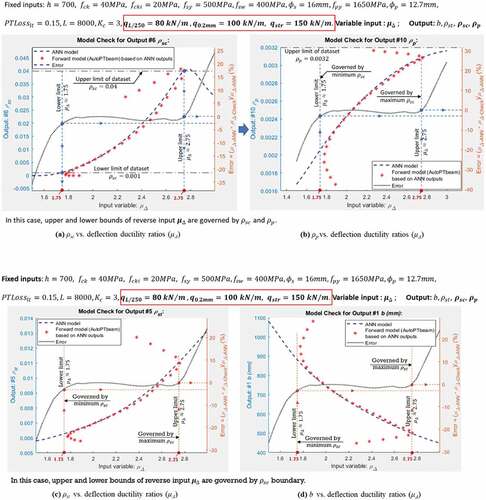
Figure 23. Design accuracies of Reverse Scenario based on CRS (DNN); qL/250 = 80 kN/m at a deflection of L/250 at SLL, qstr = 150 kN/m at ULL, and deflection ductility ratios (μΔ) of 2.75, 1.50 at ULL; 30 layers-30 neurons for Step 1.
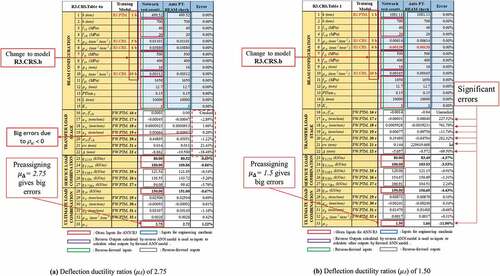
Figure 24. Design accuracies of Reverse Scenario based on CRS (DNN); qL/250 = 80 kN/m at a deflection of L/250 at SLL, qstr = 150 kN/m at ULL, and deflection ductility ratios (μΔ) of 2.75, 1.50 at ULL; 40 layers-40 neurons for Step 1.
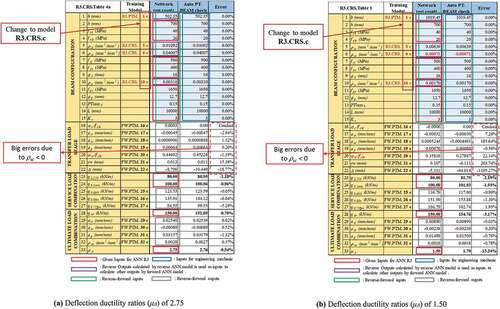
Figure 25. Design accuracies of Reverse Scenario based on CRS (DNN); qL/250 = 80 kN/m at a deflection of L/250 at SLL, qstr = 150 kN/m at ULL, and deflection ductility ratios (μΔ) of 2.50, 3.00 at ULL; 30 layers-30 neurons for Step 1.
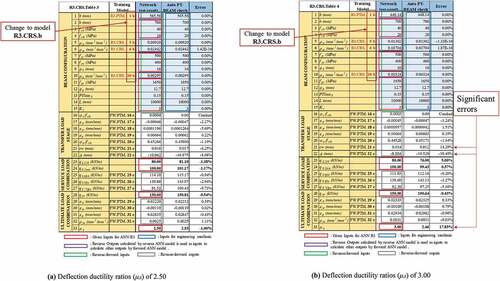
Figure 26. Design accuracies of Reverse Scenario based on CRS (DNN); qL/250 = 80 kN/m at a deflection of L/250 at SLL, qstr = 150 kN/m at ULL, and deflection ductility ratios (μΔ) of 2.50, 3.00 at ULL; 40 layers-40 neurons for Step 1.
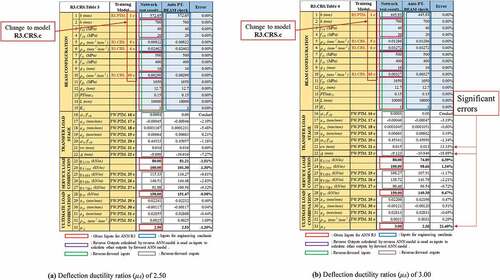
Figure 27. Design accuracies of Reverse Scenario based on CRS (DNN); qL/250 = 80 kN/m at a deflection of L/250 at SLL, qstr = 150 kN/m at ULL, and deflection ductility ratios (μΔ) of 1.75, 2.00 at ULL; 40 layers-40 neurons and 30 layers-30 neurons for Step 1.
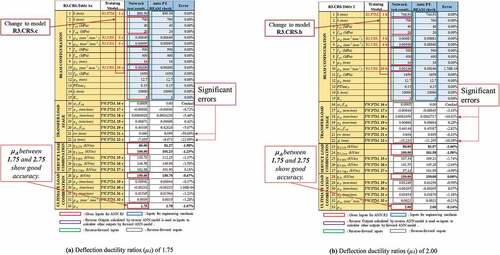
Table 7. Training accuracies of a reverse scenario based on deep and shallow ANNs; training accuracies obtained by mapping b based on PTM and ρst,ρsc, and ρp based on CRS.
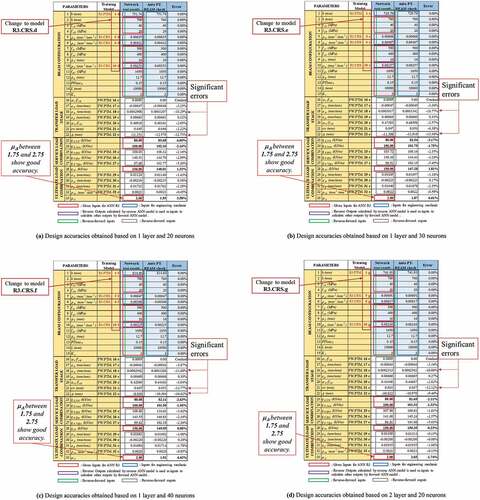
Figure 28. Design accuracies of Reverse Scenario 3 based on deep and shallow ANNs.